Immigrants from Cambodia vs Macedonian Self-Care Disability
COMPARE
Immigrants from Cambodia
Macedonian
Self-Care Disability
Self-Care Disability Comparison
Immigrants from Cambodia
Macedonians
2.7%
SELF-CARE DISABILITY
0.1/ 100
METRIC RATING
266th/ 347
METRIC RANK
2.4%
SELF-CARE DISABILITY
96.9/ 100
METRIC RATING
94th/ 347
METRIC RANK
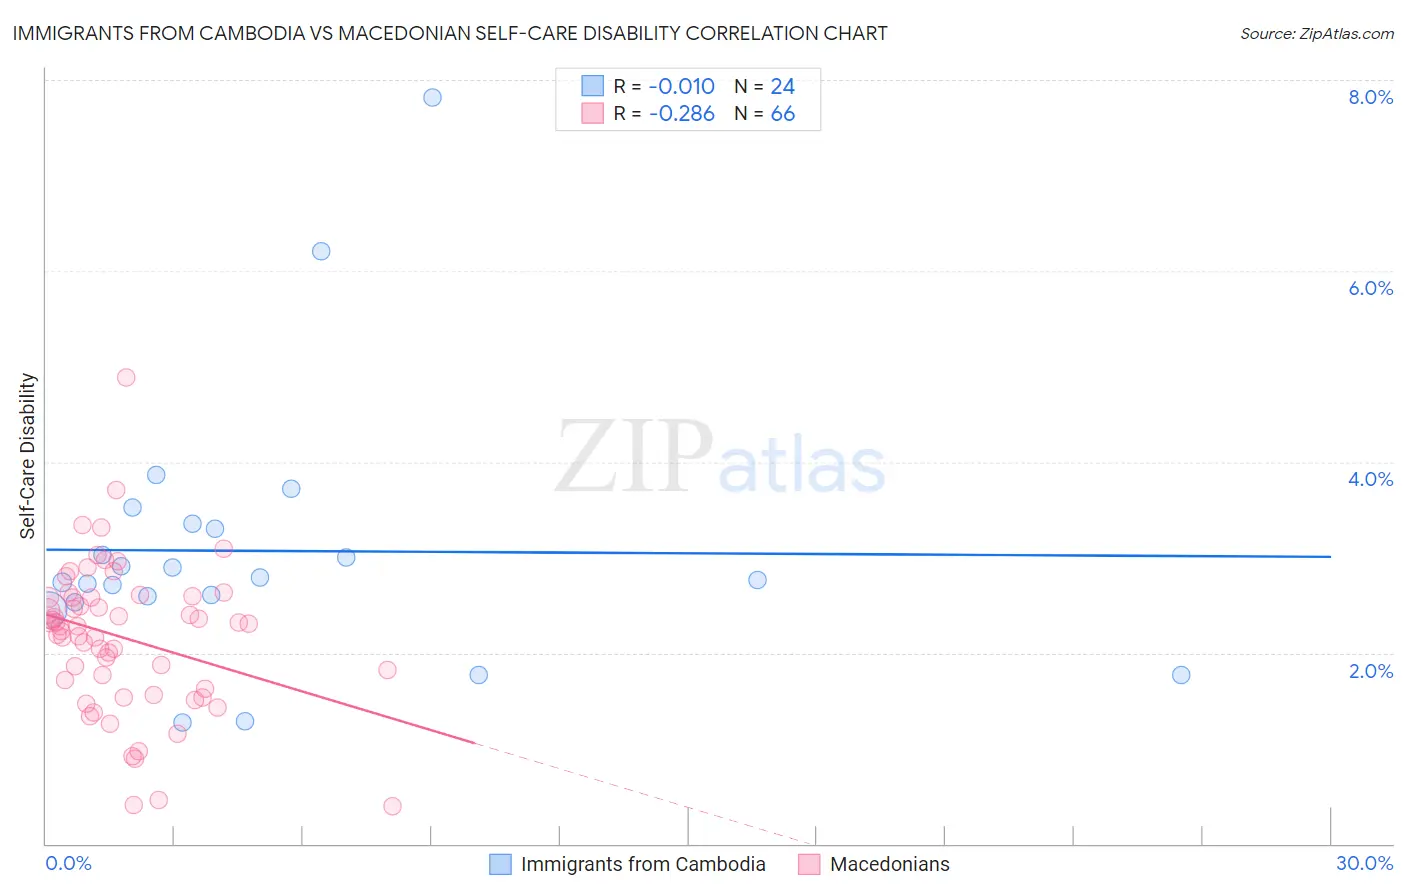
Immigrants from Cambodia vs Macedonian Self-Care Disability Correlation Chart
The statistical analysis conducted on geographies consisting of 205,114,644 people shows no correlation between the proportion of Immigrants from Cambodia and percentage of population with self-care disability in the United States with a correlation coefficient (R) of -0.010 and weighted average of 2.7%. Similarly, the statistical analysis conducted on geographies consisting of 132,583,440 people shows a weak negative correlation between the proportion of Macedonians and percentage of population with self-care disability in the United States with a correlation coefficient (R) of -0.286 and weighted average of 2.4%, a difference of 12.4%.
Self-Care Disability Correlation Summary
| Measurement | Immigrants from Cambodia | Macedonian |
| Minimum | 1.3% | 0.40% |
| Maximum | 7.8% | 4.9% |
| Range | 6.5% | 4.5% |
| Mean | 3.1% | 2.2% |
| Median | 2.8% | 2.3% |
| Interquartile 25% (IQ1) | 2.6% | 1.6% |
| Interquartile 75% (IQ3) | 3.3% | 2.6% |
| Interquartile Range (IQR) | 0.76% | 0.97% |
| Standard Deviation (Sample) | 1.4% | 0.78% |
| Standard Deviation (Population) | 1.4% | 0.78% |
Similar Demographics by Self-Care Disability
Demographics Similar to Immigrants from Cambodia by Self-Care Disability
In terms of self-care disability, the demographic groups most similar to Immigrants from Cambodia are Immigrants from Nicaragua (2.7%, a difference of 0.050%), Yaqui (2.7%, a difference of 0.19%), Immigrants from Iran (2.7%, a difference of 0.21%), Immigrants from Mexico (2.7%, a difference of 0.24%), and Immigrants from Latin America (2.7%, a difference of 0.27%).
| Demographics | Rating | Rank | Self-Care Disability |
| Immigrants | Belarus | 0.2 /100 | #259 | Tragic 2.6% |
| Chippewa | 0.2 /100 | #260 | Tragic 2.6% |
| Arapaho | 0.2 /100 | #261 | Tragic 2.6% |
| Shoshone | 0.2 /100 | #262 | Tragic 2.7% |
| Immigrants | Latin America | 0.2 /100 | #263 | Tragic 2.7% |
| Immigrants | Iran | 0.2 /100 | #264 | Tragic 2.7% |
| Immigrants | Nicaragua | 0.2 /100 | #265 | Tragic 2.7% |
| Immigrants | Cambodia | 0.1 /100 | #266 | Tragic 2.7% |
| Yaqui | 0.1 /100 | #267 | Tragic 2.7% |
| Immigrants | Mexico | 0.1 /100 | #268 | Tragic 2.7% |
| U.S. Virgin Islanders | 0.1 /100 | #269 | Tragic 2.7% |
| Immigrants | Micronesia | 0.1 /100 | #270 | Tragic 2.7% |
| Trinidadians and Tobagonians | 0.1 /100 | #271 | Tragic 2.7% |
| Immigrants | Laos | 0.1 /100 | #272 | Tragic 2.7% |
| Mexicans | 0.1 /100 | #273 | Tragic 2.7% |
Demographics Similar to Macedonians by Self-Care Disability
In terms of self-care disability, the demographic groups most similar to Macedonians are Immigrants from Asia (2.4%, a difference of 0.010%), Immigrants from Latvia (2.4%, a difference of 0.040%), Immigrants from Chile (2.4%, a difference of 0.070%), Swiss (2.4%, a difference of 0.11%), and Immigrants from Poland (2.4%, a difference of 0.20%).
| Demographics | Rating | Rank | Self-Care Disability |
| Sierra Leoneans | 98.0 /100 | #87 | Exceptional 2.4% |
| Lithuanians | 98.0 /100 | #88 | Exceptional 2.4% |
| Immigrants | Congo | 98.0 /100 | #89 | Exceptional 2.4% |
| Immigrants | Czechoslovakia | 97.7 /100 | #90 | Exceptional 2.4% |
| Immigrants | Jordan | 97.7 /100 | #91 | Exceptional 2.4% |
| Icelanders | 97.4 /100 | #92 | Exceptional 2.4% |
| Immigrants | Latvia | 97.0 /100 | #93 | Exceptional 2.4% |
| Macedonians | 96.9 /100 | #94 | Exceptional 2.4% |
| Immigrants | Asia | 96.9 /100 | #95 | Exceptional 2.4% |
| Immigrants | Chile | 96.7 /100 | #96 | Exceptional 2.4% |
| Swiss | 96.6 /100 | #97 | Exceptional 2.4% |
| Immigrants | Poland | 96.4 /100 | #98 | Exceptional 2.4% |
| Immigrants | Israel | 96.1 /100 | #99 | Exceptional 2.4% |
| Europeans | 95.8 /100 | #100 | Exceptional 2.4% |
| Immigrants | Scotland | 95.7 /100 | #101 | Exceptional 2.4% |