Immigrants from Cambodia vs Macedonian 3rd Grade
COMPARE
Immigrants from Cambodia
Macedonian
3rd Grade
3rd Grade Comparison
Immigrants from Cambodia
Macedonians
96.2%
3RD GRADE
0.0/ 100
METRIC RATING
334th/ 347
METRIC RANK
98.1%
3RD GRADE
99.1/ 100
METRIC RATING
80th/ 347
METRIC RANK
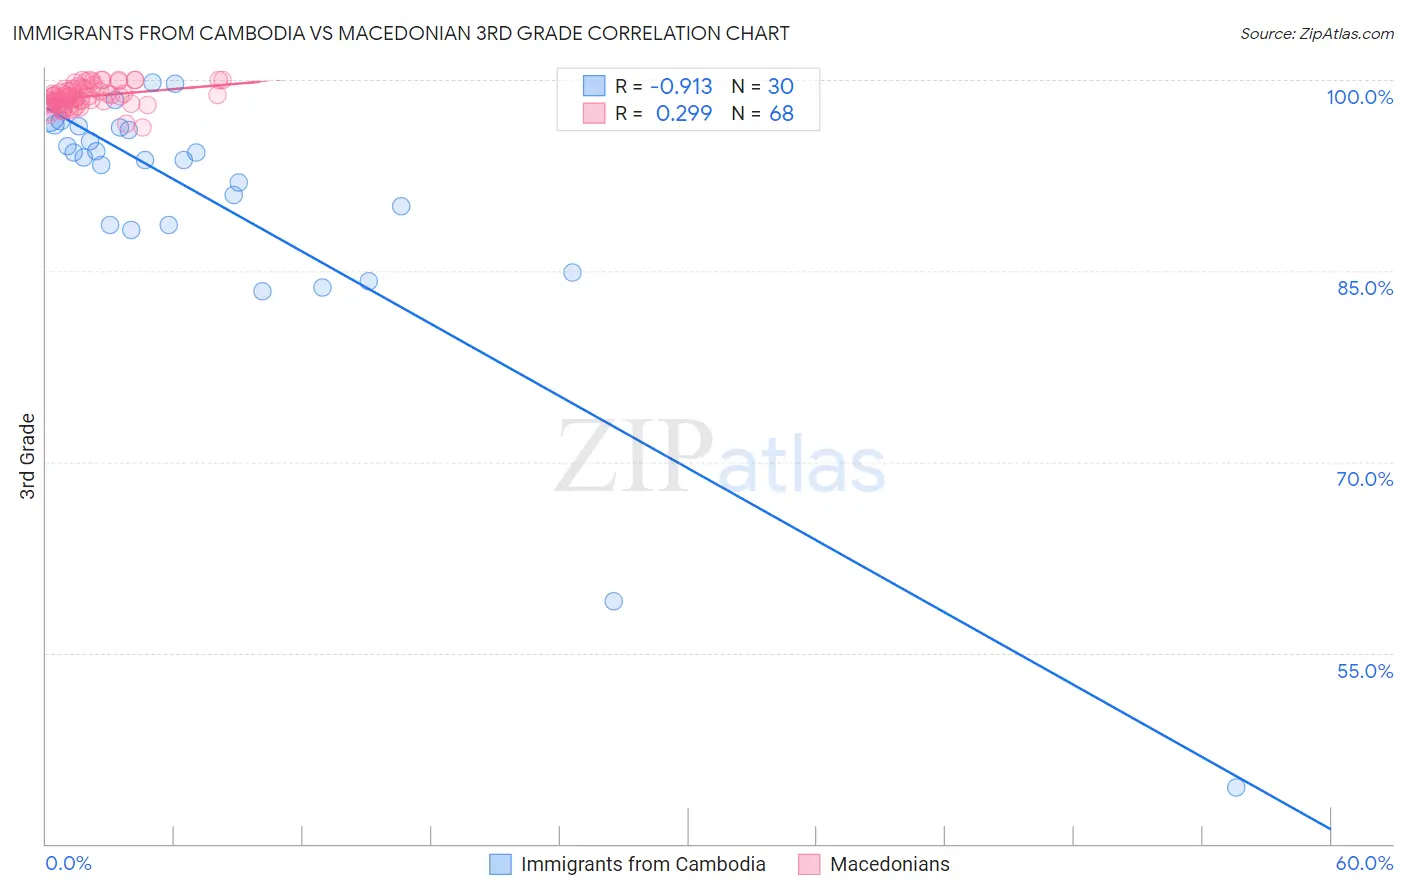
Immigrants from Cambodia vs Macedonian 3rd Grade Correlation Chart
The statistical analysis conducted on geographies consisting of 205,153,442 people shows a near-perfect negative correlation between the proportion of Immigrants from Cambodia and percentage of population with at least 3rd grade education in the United States with a correlation coefficient (R) of -0.913 and weighted average of 96.2%. Similarly, the statistical analysis conducted on geographies consisting of 132,592,860 people shows a weak positive correlation between the proportion of Macedonians and percentage of population with at least 3rd grade education in the United States with a correlation coefficient (R) of 0.299 and weighted average of 98.1%, a difference of 2.0%.
3rd Grade Correlation Summary
| Measurement | Immigrants from Cambodia | Macedonian |
| Minimum | 44.4% | 96.3% |
| Maximum | 99.8% | 100.0% |
| Range | 55.4% | 3.7% |
| Mean | 90.1% | 98.7% |
| Median | 93.8% | 98.7% |
| Interquartile 25% (IQ1) | 88.6% | 98.1% |
| Interquartile 75% (IQ3) | 96.2% | 99.3% |
| Interquartile Range (IQR) | 7.6% | 1.2% |
| Standard Deviation (Sample) | 11.6% | 0.86% |
| Standard Deviation (Population) | 11.4% | 0.85% |
Similar Demographics by 3rd Grade
Demographics Similar to Immigrants from Cambodia by 3rd Grade
In terms of 3rd grade, the demographic groups most similar to Immigrants from Cambodia are Immigrants from Dominican Republic (96.2%, a difference of 0.0%), Immigrants from Fiji (96.2%, a difference of 0.020%), Immigrants from Cabo Verde (96.2%, a difference of 0.020%), Mexican (96.2%, a difference of 0.050%), and Immigrants from Latin America (96.2%, a difference of 0.060%).
| Demographics | Rating | Rank | 3rd Grade |
| Japanese | 0.0 /100 | #327 | Tragic 96.4% |
| Bangladeshis | 0.0 /100 | #328 | Tragic 96.3% |
| Immigrants | Honduras | 0.0 /100 | #329 | Tragic 96.3% |
| Immigrants | Armenia | 0.0 /100 | #330 | Tragic 96.3% |
| Immigrants | Latin America | 0.0 /100 | #331 | Tragic 96.2% |
| Mexicans | 0.0 /100 | #332 | Tragic 96.2% |
| Immigrants | Fiji | 0.0 /100 | #333 | Tragic 96.2% |
| Immigrants | Cambodia | 0.0 /100 | #334 | Tragic 96.2% |
| Immigrants | Dominican Republic | 0.0 /100 | #335 | Tragic 96.2% |
| Immigrants | Cabo Verde | 0.0 /100 | #336 | Tragic 96.2% |
| Central Americans | 0.0 /100 | #337 | Tragic 96.1% |
| Guatemalans | 0.0 /100 | #338 | Tragic 96.0% |
| Yakama | 0.0 /100 | #339 | Tragic 95.9% |
| Nepalese | 0.0 /100 | #340 | Tragic 95.9% |
| Immigrants | Central America | 0.0 /100 | #341 | Tragic 95.8% |
Demographics Similar to Macedonians by 3rd Grade
In terms of 3rd grade, the demographic groups most similar to Macedonians are Immigrants from Belgium (98.1%, a difference of 0.0%), Icelander (98.1%, a difference of 0.0%), Immigrants from Lithuania (98.2%, a difference of 0.010%), Osage (98.2%, a difference of 0.010%), and Shoshone (98.1%, a difference of 0.010%).
| Demographics | Rating | Rank | 3rd Grade |
| Cheyenne | 99.3 /100 | #73 | Exceptional 98.2% |
| Immigrants | Netherlands | 99.3 /100 | #74 | Exceptional 98.2% |
| Cherokee | 99.3 /100 | #75 | Exceptional 98.2% |
| Immigrants | England | 99.2 /100 | #76 | Exceptional 98.2% |
| Immigrants | Lithuania | 99.2 /100 | #77 | Exceptional 98.2% |
| Osage | 99.2 /100 | #78 | Exceptional 98.2% |
| Immigrants | Belgium | 99.1 /100 | #79 | Exceptional 98.1% |
| Macedonians | 99.1 /100 | #80 | Exceptional 98.1% |
| Icelanders | 99.1 /100 | #81 | Exceptional 98.1% |
| Shoshone | 99.0 /100 | #82 | Exceptional 98.1% |
| Ukrainians | 98.9 /100 | #83 | Exceptional 98.1% |
| Immigrants | Sweden | 98.9 /100 | #84 | Exceptional 98.1% |
| Immigrants | Australia | 98.9 /100 | #85 | Exceptional 98.1% |
| Potawatomi | 98.9 /100 | #86 | Exceptional 98.1% |
| Immigrants | Denmark | 98.8 /100 | #87 | Exceptional 98.1% |