Paiute vs Macedonian Self-Care Disability
COMPARE
Paiute
Macedonian
Self-Care Disability
Self-Care Disability Comparison
Paiute
Macedonians
2.9%
SELF-CARE DISABILITY
0.0/ 100
METRIC RATING
326th/ 347
METRIC RANK
2.4%
SELF-CARE DISABILITY
96.9/ 100
METRIC RATING
94th/ 347
METRIC RANK
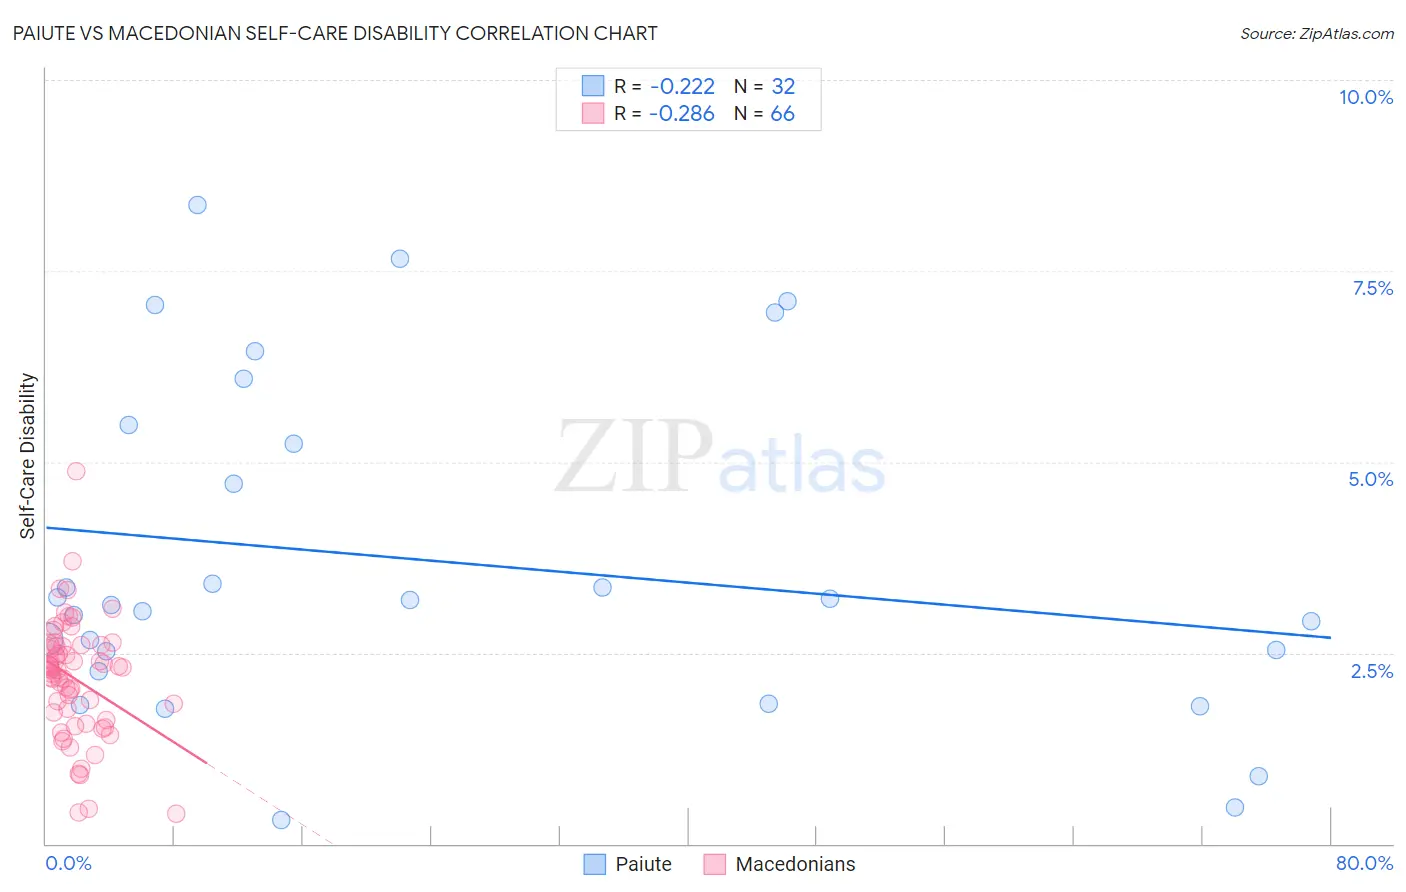
Paiute vs Macedonian Self-Care Disability Correlation Chart
The statistical analysis conducted on geographies consisting of 58,381,143 people shows a weak negative correlation between the proportion of Paiute and percentage of population with self-care disability in the United States with a correlation coefficient (R) of -0.222 and weighted average of 2.9%. Similarly, the statistical analysis conducted on geographies consisting of 132,583,440 people shows a weak negative correlation between the proportion of Macedonians and percentage of population with self-care disability in the United States with a correlation coefficient (R) of -0.286 and weighted average of 2.4%, a difference of 23.5%.
Self-Care Disability Correlation Summary
| Measurement | Paiute | Macedonian |
| Minimum | 0.31% | 0.40% |
| Maximum | 8.4% | 4.9% |
| Range | 8.1% | 4.5% |
| Mean | 3.7% | 2.2% |
| Median | 3.2% | 2.3% |
| Interquartile 25% (IQ1) | 2.4% | 1.6% |
| Interquartile 75% (IQ3) | 5.4% | 2.6% |
| Interquartile Range (IQR) | 3.0% | 0.97% |
| Standard Deviation (Sample) | 2.2% | 0.78% |
| Standard Deviation (Population) | 2.1% | 0.78% |
Similar Demographics by Self-Care Disability
Demographics Similar to Paiute by Self-Care Disability
In terms of self-care disability, the demographic groups most similar to Paiute are Black/African American (2.9%, a difference of 0.070%), Hopi (2.9%, a difference of 0.45%), Cajun (2.9%, a difference of 0.67%), Immigrants from Uzbekistan (2.9%, a difference of 0.94%), and Nepalese (3.0%, a difference of 1.4%).
| Demographics | Rating | Rank | Self-Care Disability |
| Spanish American Indians | 0.0 /100 | #319 | Tragic 2.9% |
| Chickasaw | 0.0 /100 | #320 | Tragic 2.9% |
| Navajo | 0.0 /100 | #321 | Tragic 2.9% |
| Comanche | 0.0 /100 | #322 | Tragic 2.9% |
| Seminole | 0.0 /100 | #323 | Tragic 2.9% |
| Cherokee | 0.0 /100 | #324 | Tragic 2.9% |
| Immigrants | Uzbekistan | 0.0 /100 | #325 | Tragic 2.9% |
| Paiute | 0.0 /100 | #326 | Tragic 2.9% |
| Blacks/African Americans | 0.0 /100 | #327 | Tragic 2.9% |
| Hopi | 0.0 /100 | #328 | Tragic 2.9% |
| Cajuns | 0.0 /100 | #329 | Tragic 2.9% |
| Nepalese | 0.0 /100 | #330 | Tragic 3.0% |
| Lumbee | 0.0 /100 | #331 | Tragic 3.0% |
| Kiowa | 0.0 /100 | #332 | Tragic 3.0% |
| Dutch West Indians | 0.0 /100 | #333 | Tragic 3.0% |
Demographics Similar to Macedonians by Self-Care Disability
In terms of self-care disability, the demographic groups most similar to Macedonians are Immigrants from Asia (2.4%, a difference of 0.010%), Immigrants from Latvia (2.4%, a difference of 0.040%), Immigrants from Chile (2.4%, a difference of 0.070%), Swiss (2.4%, a difference of 0.11%), and Immigrants from Poland (2.4%, a difference of 0.20%).
| Demographics | Rating | Rank | Self-Care Disability |
| Sierra Leoneans | 98.0 /100 | #87 | Exceptional 2.4% |
| Lithuanians | 98.0 /100 | #88 | Exceptional 2.4% |
| Immigrants | Congo | 98.0 /100 | #89 | Exceptional 2.4% |
| Immigrants | Czechoslovakia | 97.7 /100 | #90 | Exceptional 2.4% |
| Immigrants | Jordan | 97.7 /100 | #91 | Exceptional 2.4% |
| Icelanders | 97.4 /100 | #92 | Exceptional 2.4% |
| Immigrants | Latvia | 97.0 /100 | #93 | Exceptional 2.4% |
| Macedonians | 96.9 /100 | #94 | Exceptional 2.4% |
| Immigrants | Asia | 96.9 /100 | #95 | Exceptional 2.4% |
| Immigrants | Chile | 96.7 /100 | #96 | Exceptional 2.4% |
| Swiss | 96.6 /100 | #97 | Exceptional 2.4% |
| Immigrants | Poland | 96.4 /100 | #98 | Exceptional 2.4% |
| Immigrants | Israel | 96.1 /100 | #99 | Exceptional 2.4% |
| Europeans | 95.8 /100 | #100 | Exceptional 2.4% |
| Immigrants | Scotland | 95.7 /100 | #101 | Exceptional 2.4% |