Immigrants from Cambodia vs Yuman Self-Care Disability
COMPARE
Immigrants from Cambodia
Yuman
Self-Care Disability
Self-Care Disability Comparison
Immigrants from Cambodia
Yuman
2.7%
SELF-CARE DISABILITY
0.1/ 100
METRIC RATING
266th/ 347
METRIC RANK
2.6%
SELF-CARE DISABILITY
0.8/ 100
METRIC RATING
244th/ 347
METRIC RANK
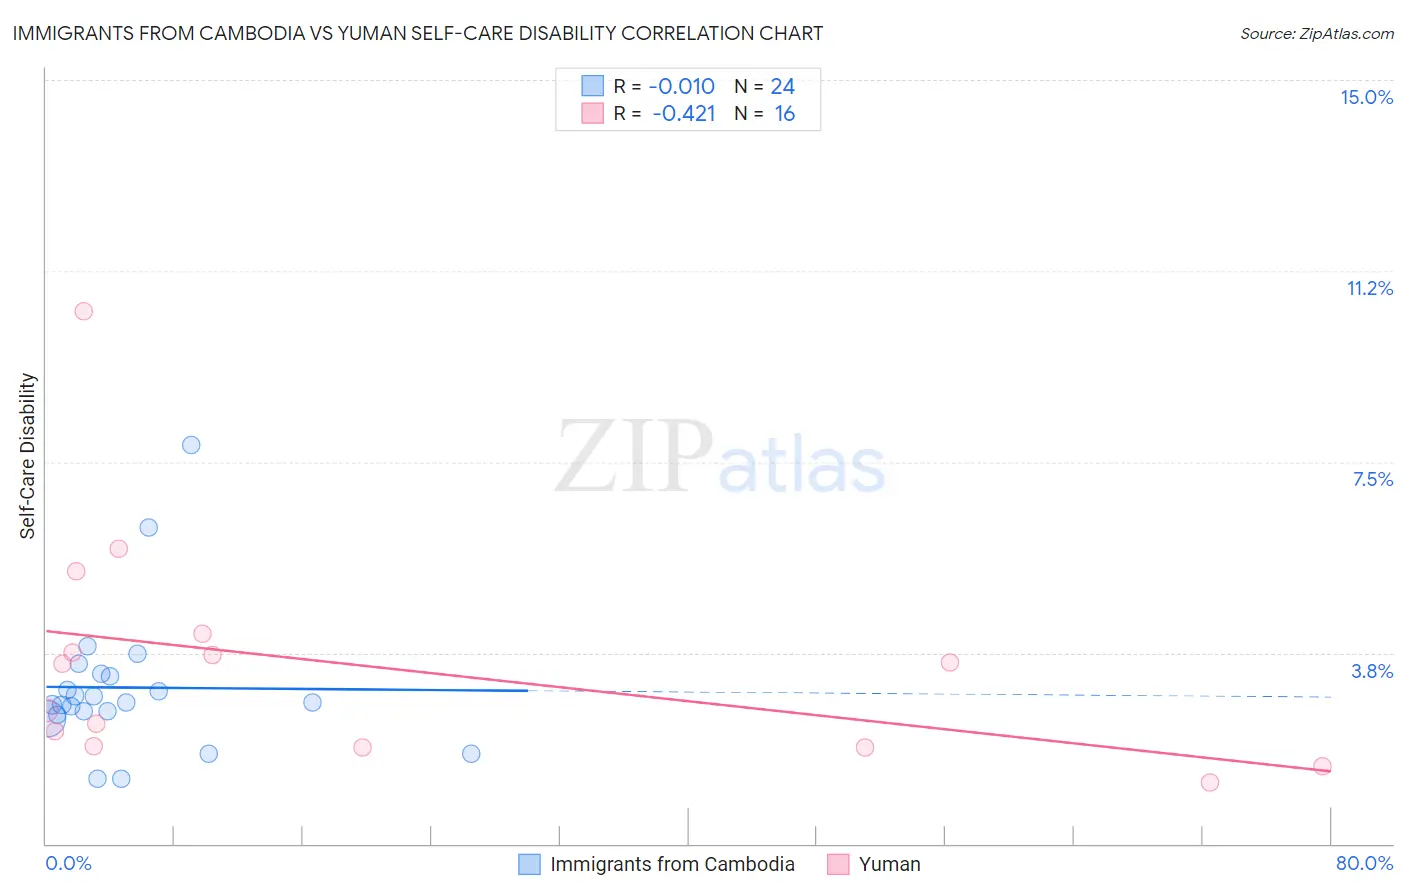
Immigrants from Cambodia vs Yuman Self-Care Disability Correlation Chart
The statistical analysis conducted on geographies consisting of 205,114,644 people shows no correlation between the proportion of Immigrants from Cambodia and percentage of population with self-care disability in the United States with a correlation coefficient (R) of -0.010 and weighted average of 2.7%. Similarly, the statistical analysis conducted on geographies consisting of 40,644,588 people shows a moderate negative correlation between the proportion of Yuman and percentage of population with self-care disability in the United States with a correlation coefficient (R) of -0.421 and weighted average of 2.6%, a difference of 1.9%.
Self-Care Disability Correlation Summary
| Measurement | Immigrants from Cambodia | Yuman |
| Minimum | 1.3% | 1.2% |
| Maximum | 7.8% | 10.5% |
| Range | 6.5% | 9.3% |
| Mean | 3.1% | 3.5% |
| Median | 2.8% | 3.1% |
| Interquartile 25% (IQ1) | 2.6% | 1.9% |
| Interquartile 75% (IQ3) | 3.3% | 3.9% |
| Interquartile Range (IQR) | 0.76% | 2.0% |
| Standard Deviation (Sample) | 1.4% | 2.3% |
| Standard Deviation (Population) | 1.4% | 2.2% |
Similar Demographics by Self-Care Disability
Demographics Similar to Immigrants from Cambodia by Self-Care Disability
In terms of self-care disability, the demographic groups most similar to Immigrants from Cambodia are Immigrants from Nicaragua (2.7%, a difference of 0.050%), Yaqui (2.7%, a difference of 0.19%), Immigrants from Iran (2.7%, a difference of 0.21%), Immigrants from Mexico (2.7%, a difference of 0.24%), and Immigrants from Latin America (2.7%, a difference of 0.27%).
| Demographics | Rating | Rank | Self-Care Disability |
| Immigrants | Belarus | 0.2 /100 | #259 | Tragic 2.6% |
| Chippewa | 0.2 /100 | #260 | Tragic 2.6% |
| Arapaho | 0.2 /100 | #261 | Tragic 2.6% |
| Shoshone | 0.2 /100 | #262 | Tragic 2.7% |
| Immigrants | Latin America | 0.2 /100 | #263 | Tragic 2.7% |
| Immigrants | Iran | 0.2 /100 | #264 | Tragic 2.7% |
| Immigrants | Nicaragua | 0.2 /100 | #265 | Tragic 2.7% |
| Immigrants | Cambodia | 0.1 /100 | #266 | Tragic 2.7% |
| Yaqui | 0.1 /100 | #267 | Tragic 2.7% |
| Immigrants | Mexico | 0.1 /100 | #268 | Tragic 2.7% |
| U.S. Virgin Islanders | 0.1 /100 | #269 | Tragic 2.7% |
| Immigrants | Micronesia | 0.1 /100 | #270 | Tragic 2.7% |
| Trinidadians and Tobagonians | 0.1 /100 | #271 | Tragic 2.7% |
| Immigrants | Laos | 0.1 /100 | #272 | Tragic 2.7% |
| Mexicans | 0.1 /100 | #273 | Tragic 2.7% |
Demographics Similar to Yuman by Self-Care Disability
In terms of self-care disability, the demographic groups most similar to Yuman are Hawaiian (2.6%, a difference of 0.040%), Spanish (2.6%, a difference of 0.11%), Immigrants from Western Asia (2.6%, a difference of 0.19%), Cheyenne (2.6%, a difference of 0.21%), and Immigrants from Albania (2.6%, a difference of 0.33%).
| Demographics | Rating | Rank | Self-Care Disability |
| Immigrants | Senegal | 1.6 /100 | #237 | Tragic 2.6% |
| Senegalese | 1.3 /100 | #238 | Tragic 2.6% |
| Immigrants | Panama | 1.2 /100 | #239 | Tragic 2.6% |
| Marshallese | 1.2 /100 | #240 | Tragic 2.6% |
| Immigrants | Syria | 1.0 /100 | #241 | Tragic 2.6% |
| Spanish | 0.8 /100 | #242 | Tragic 2.6% |
| Hawaiians | 0.8 /100 | #243 | Tragic 2.6% |
| Yuman | 0.8 /100 | #244 | Tragic 2.6% |
| Immigrants | Western Asia | 0.6 /100 | #245 | Tragic 2.6% |
| Cheyenne | 0.6 /100 | #246 | Tragic 2.6% |
| Immigrants | Albania | 0.6 /100 | #247 | Tragic 2.6% |
| Nicaraguans | 0.6 /100 | #248 | Tragic 2.6% |
| Mexican American Indians | 0.5 /100 | #249 | Tragic 2.6% |
| Portuguese | 0.4 /100 | #250 | Tragic 2.6% |
| Immigrants | Liberia | 0.4 /100 | #251 | Tragic 2.6% |