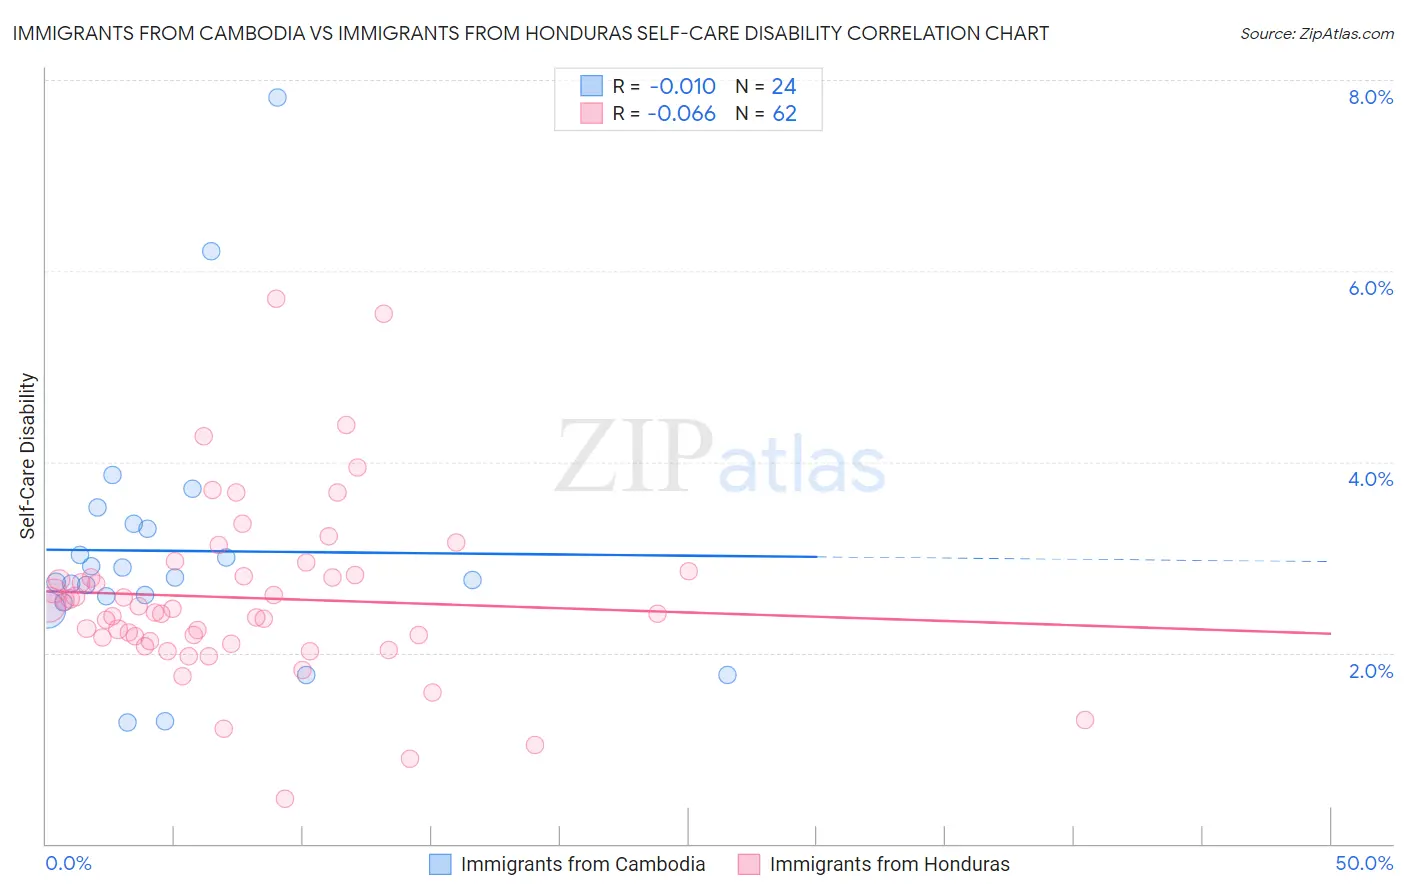
Immigrants from Cambodia vs Immigrants from Honduras Self-Care Disability
COMPARE
Immigrants from Cambodia
Immigrants from Honduras
Self-Care Disability
Self-Care Disability Comparison
Immigrants from Cambodia
Immigrants from Honduras
2.7%
SELF-CARE DISABILITY
0.1/ 100
METRIC RATING
266th/ 347
METRIC RANK
2.6%
SELF-CARE DISABILITY
4.7/ 100
METRIC RATING
214th/ 347
METRIC RANK
Immigrants from Cambodia vs Immigrants from Honduras Self-Care Disability Correlation Chart
The statistical analysis conducted on geographies consisting of 205,114,644 people shows no correlation between the proportion of Immigrants from Cambodia and percentage of population with self-care disability in the United States with a correlation coefficient (R) of -0.010 and weighted average of 2.7%. Similarly, the statistical analysis conducted on geographies consisting of 322,379,490 people shows a slight negative correlation between the proportion of Immigrants from Honduras and percentage of population with self-care disability in the United States with a correlation coefficient (R) of -0.066 and weighted average of 2.6%, a difference of 4.0%.
Self-Care Disability Correlation Summary
| Measurement | Immigrants from Cambodia | Immigrants from Honduras |
| Minimum | 1.3% | 0.48% |
| Maximum | 7.8% | 5.7% |
| Range | 6.5% | 5.2% |
| Mean | 3.1% | 2.6% |
| Median | 2.8% | 2.4% |
| Interquartile 25% (IQ1) | 2.6% | 2.1% |
| Interquartile 75% (IQ3) | 3.3% | 2.8% |
| Interquartile Range (IQR) | 0.76% | 0.70% |
| Standard Deviation (Sample) | 1.4% | 0.92% |
| Standard Deviation (Population) | 1.4% | 0.91% |
Similar Demographics by Self-Care Disability
Demographics Similar to Immigrants from Cambodia by Self-Care Disability
In terms of self-care disability, the demographic groups most similar to Immigrants from Cambodia are Immigrants from Nicaragua (2.7%, a difference of 0.050%), Yaqui (2.7%, a difference of 0.19%), Immigrants from Iran (2.7%, a difference of 0.21%), Immigrants from Mexico (2.7%, a difference of 0.24%), and Immigrants from Latin America (2.7%, a difference of 0.27%).
| Demographics | Rating | Rank | Self-Care Disability |
| Immigrants | Belarus | 0.2 /100 | #259 | Tragic 2.6% |
| Chippewa | 0.2 /100 | #260 | Tragic 2.6% |
| Arapaho | 0.2 /100 | #261 | Tragic 2.6% |
| Shoshone | 0.2 /100 | #262 | Tragic 2.7% |
| Immigrants | Latin America | 0.2 /100 | #263 | Tragic 2.7% |
| Immigrants | Iran | 0.2 /100 | #264 | Tragic 2.7% |
| Immigrants | Nicaragua | 0.2 /100 | #265 | Tragic 2.7% |
| Immigrants | Cambodia | 0.1 /100 | #266 | Tragic 2.7% |
| Yaqui | 0.1 /100 | #267 | Tragic 2.7% |
| Immigrants | Mexico | 0.1 /100 | #268 | Tragic 2.7% |
| U.S. Virgin Islanders | 0.1 /100 | #269 | Tragic 2.7% |
| Immigrants | Micronesia | 0.1 /100 | #270 | Tragic 2.7% |
| Trinidadians and Tobagonians | 0.1 /100 | #271 | Tragic 2.7% |
| Immigrants | Laos | 0.1 /100 | #272 | Tragic 2.7% |
| Mexicans | 0.1 /100 | #273 | Tragic 2.7% |
Demographics Similar to Immigrants from Honduras by Self-Care Disability
In terms of self-care disability, the demographic groups most similar to Immigrants from Honduras are Ecuadorian (2.6%, a difference of 0.0%), Immigrants from Thailand (2.6%, a difference of 0.040%), White/Caucasian (2.6%, a difference of 0.070%), Celtic (2.6%, a difference of 0.090%), and Samoan (2.6%, a difference of 0.10%).
| Demographics | Rating | Rank | Self-Care Disability |
| French | 9.9 /100 | #207 | Tragic 2.5% |
| Central Americans | 8.7 /100 | #208 | Tragic 2.5% |
| Malaysians | 7.7 /100 | #209 | Tragic 2.5% |
| Panamanians | 6.4 /100 | #210 | Tragic 2.5% |
| Native Hawaiians | 5.1 /100 | #211 | Tragic 2.6% |
| Samoans | 5.1 /100 | #212 | Tragic 2.6% |
| Ecuadorians | 4.7 /100 | #213 | Tragic 2.6% |
| Immigrants | Honduras | 4.7 /100 | #214 | Tragic 2.6% |
| Immigrants | Thailand | 4.5 /100 | #215 | Tragic 2.6% |
| Whites/Caucasians | 4.4 /100 | #216 | Tragic 2.6% |
| Celtics | 4.4 /100 | #217 | Tragic 2.6% |
| Scotch-Irish | 4.1 /100 | #218 | Tragic 2.6% |
| Immigrants | Moldova | 4.0 /100 | #219 | Tragic 2.6% |
| Sub-Saharan Africans | 4.0 /100 | #220 | Tragic 2.6% |
| Hondurans | 3.8 /100 | #221 | Tragic 2.6% |