Bahamian vs Macedonian Self-Care Disability
COMPARE
Bahamian
Macedonian
Self-Care Disability
Self-Care Disability Comparison
Bahamians
Macedonians
2.6%
SELF-CARE DISABILITY
2.0/ 100
METRIC RATING
235th/ 347
METRIC RANK
2.4%
SELF-CARE DISABILITY
96.9/ 100
METRIC RATING
94th/ 347
METRIC RANK
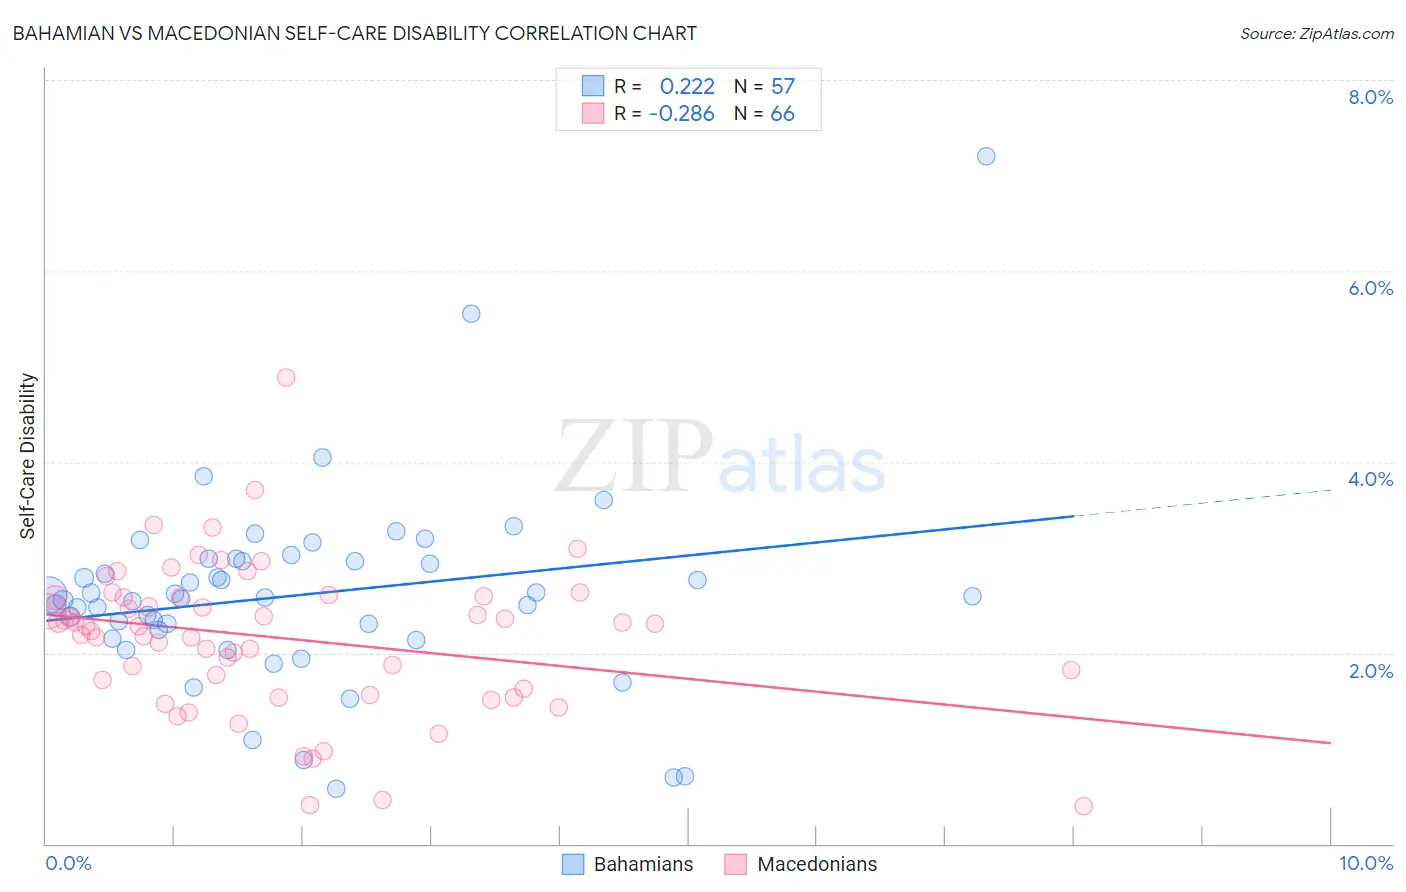
Bahamian vs Macedonian Self-Care Disability Correlation Chart
The statistical analysis conducted on geographies consisting of 112,612,333 people shows a weak positive correlation between the proportion of Bahamians and percentage of population with self-care disability in the United States with a correlation coefficient (R) of 0.222 and weighted average of 2.6%. Similarly, the statistical analysis conducted on geographies consisting of 132,583,440 people shows a weak negative correlation between the proportion of Macedonians and percentage of population with self-care disability in the United States with a correlation coefficient (R) of -0.286 and weighted average of 2.4%, a difference of 9.1%.
Self-Care Disability Correlation Summary
| Measurement | Bahamian | Macedonian |
| Minimum | 0.58% | 0.40% |
| Maximum | 7.2% | 4.9% |
| Range | 6.6% | 4.5% |
| Mean | 2.6% | 2.2% |
| Median | 2.6% | 2.3% |
| Interquartile 25% (IQ1) | 2.2% | 1.6% |
| Interquartile 75% (IQ3) | 3.0% | 2.6% |
| Interquartile Range (IQR) | 0.77% | 0.97% |
| Standard Deviation (Sample) | 1.0% | 0.78% |
| Standard Deviation (Population) | 1.0% | 0.78% |
Similar Demographics by Self-Care Disability
Demographics Similar to Bahamians by Self-Care Disability
In terms of self-care disability, the demographic groups most similar to Bahamians are Liberian (2.6%, a difference of 0.040%), Vietnamese (2.6%, a difference of 0.040%), Bermudan (2.6%, a difference of 0.070%), Albanian (2.6%, a difference of 0.090%), and Immigrants from Guatemala (2.6%, a difference of 0.11%).
| Demographics | Rating | Rank | Self-Care Disability |
| Guatemalans | 2.7 /100 | #228 | Tragic 2.6% |
| Guamanians/Chamorros | 2.5 /100 | #229 | Tragic 2.6% |
| Immigrants | Ecuador | 2.5 /100 | #230 | Tragic 2.6% |
| Immigrants | Guatemala | 2.2 /100 | #231 | Tragic 2.6% |
| Albanians | 2.2 /100 | #232 | Tragic 2.6% |
| Liberians | 2.1 /100 | #233 | Tragic 2.6% |
| Vietnamese | 2.1 /100 | #234 | Tragic 2.6% |
| Bahamians | 2.0 /100 | #235 | Tragic 2.6% |
| Bermudans | 1.9 /100 | #236 | Tragic 2.6% |
| Immigrants | Senegal | 1.6 /100 | #237 | Tragic 2.6% |
| Senegalese | 1.3 /100 | #238 | Tragic 2.6% |
| Immigrants | Panama | 1.2 /100 | #239 | Tragic 2.6% |
| Marshallese | 1.2 /100 | #240 | Tragic 2.6% |
| Immigrants | Syria | 1.0 /100 | #241 | Tragic 2.6% |
| Spanish | 0.8 /100 | #242 | Tragic 2.6% |
Demographics Similar to Macedonians by Self-Care Disability
In terms of self-care disability, the demographic groups most similar to Macedonians are Immigrants from Asia (2.4%, a difference of 0.010%), Immigrants from Latvia (2.4%, a difference of 0.040%), Immigrants from Chile (2.4%, a difference of 0.070%), Swiss (2.4%, a difference of 0.11%), and Immigrants from Poland (2.4%, a difference of 0.20%).
| Demographics | Rating | Rank | Self-Care Disability |
| Sierra Leoneans | 98.0 /100 | #87 | Exceptional 2.4% |
| Lithuanians | 98.0 /100 | #88 | Exceptional 2.4% |
| Immigrants | Congo | 98.0 /100 | #89 | Exceptional 2.4% |
| Immigrants | Czechoslovakia | 97.7 /100 | #90 | Exceptional 2.4% |
| Immigrants | Jordan | 97.7 /100 | #91 | Exceptional 2.4% |
| Icelanders | 97.4 /100 | #92 | Exceptional 2.4% |
| Immigrants | Latvia | 97.0 /100 | #93 | Exceptional 2.4% |
| Macedonians | 96.9 /100 | #94 | Exceptional 2.4% |
| Immigrants | Asia | 96.9 /100 | #95 | Exceptional 2.4% |
| Immigrants | Chile | 96.7 /100 | #96 | Exceptional 2.4% |
| Swiss | 96.6 /100 | #97 | Exceptional 2.4% |
| Immigrants | Poland | 96.4 /100 | #98 | Exceptional 2.4% |
| Immigrants | Israel | 96.1 /100 | #99 | Exceptional 2.4% |
| Europeans | 95.8 /100 | #100 | Exceptional 2.4% |
| Immigrants | Scotland | 95.7 /100 | #101 | Exceptional 2.4% |