Russian vs Ghanaian Disability Age 5 to 17
COMPARE
Russian
Ghanaian
Disability Age 5 to 17
Disability Age 5 to 17 Comparison
Russians
Ghanaians
5.3%
DISABILITY AGE 5 TO 17
98.2/ 100
METRIC RATING
107th/ 347
METRIC RANK
5.8%
DISABILITY AGE 5 TO 17
4.7/ 100
METRIC RATING
230th/ 347
METRIC RANK
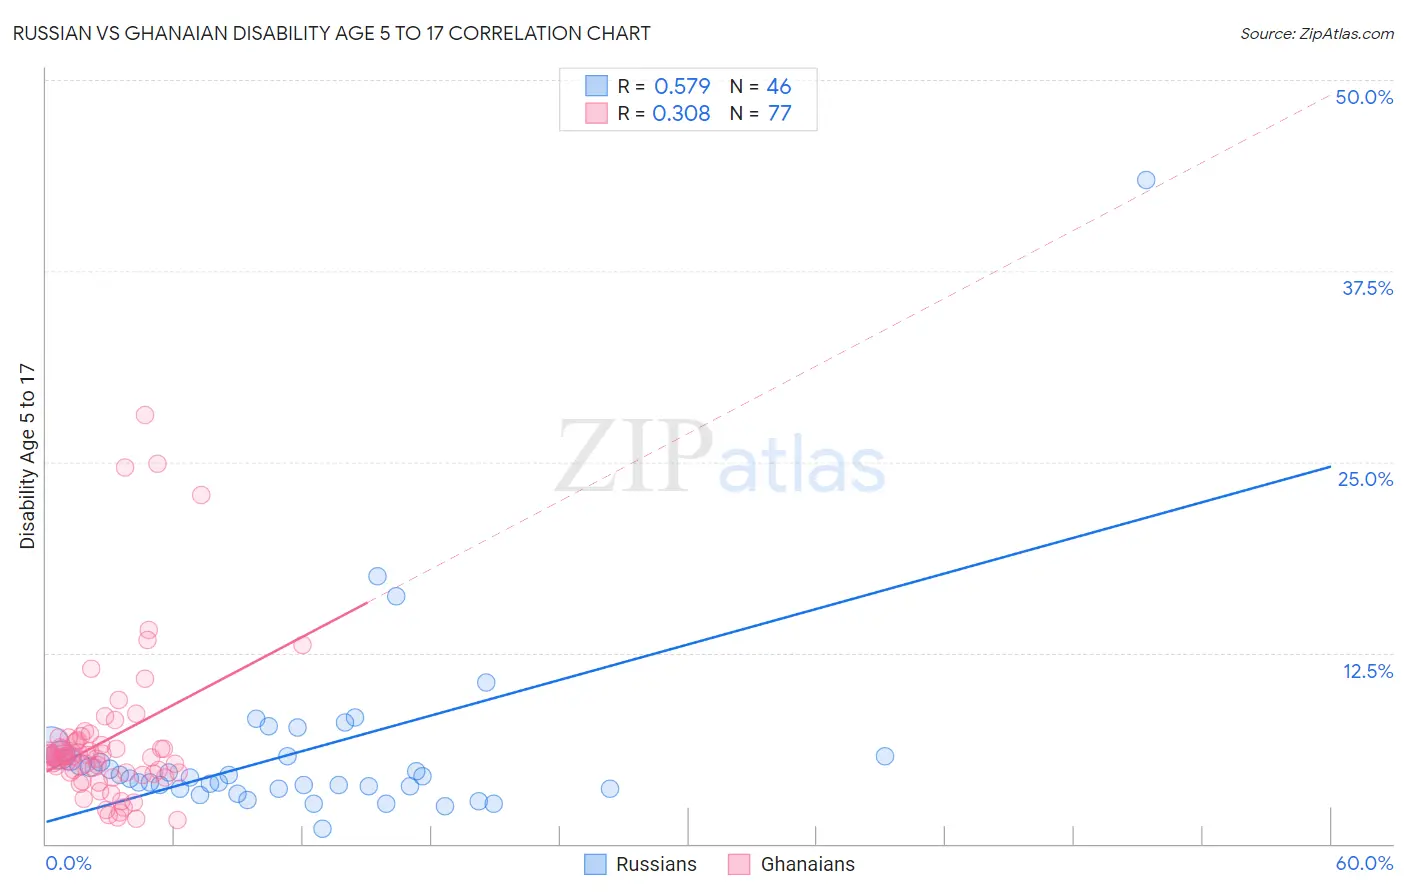
Russian vs Ghanaian Disability Age 5 to 17 Correlation Chart
The statistical analysis conducted on geographies consisting of 503,780,510 people shows a substantial positive correlation between the proportion of Russians and percentage of population with a disability between the ages 5 and 17 in the United States with a correlation coefficient (R) of 0.579 and weighted average of 5.3%. Similarly, the statistical analysis conducted on geographies consisting of 189,962,788 people shows a mild positive correlation between the proportion of Ghanaians and percentage of population with a disability between the ages 5 and 17 in the United States with a correlation coefficient (R) of 0.308 and weighted average of 5.8%, a difference of 9.1%.
Disability Age 5 to 17 Correlation Summary
| Measurement | Russian | Ghanaian |
| Minimum | 0.98% | 1.5% |
| Maximum | 43.5% | 28.1% |
| Range | 42.5% | 26.6% |
| Mean | 6.0% | 6.7% |
| Median | 4.4% | 5.7% |
| Interquartile 25% (IQ1) | 3.6% | 4.6% |
| Interquartile 75% (IQ3) | 5.7% | 6.8% |
| Interquartile Range (IQR) | 2.1% | 2.1% |
| Standard Deviation (Sample) | 6.4% | 5.0% |
| Standard Deviation (Population) | 6.4% | 4.9% |
Similar Demographics by Disability Age 5 to 17
Demographics Similar to Russians by Disability Age 5 to 17
In terms of disability age 5 to 17, the demographic groups most similar to Russians are Immigrants from Yemen (5.3%, a difference of 0.030%), Immigrants from South Africa (5.3%, a difference of 0.040%), Immigrants from Northern Africa (5.3%, a difference of 0.080%), Immigrants from Eritrea (5.3%, a difference of 0.12%), and Immigrants from Italy (5.3%, a difference of 0.16%).
| Demographics | Rating | Rank | Disability Age 5 to 17 |
| Nepalese | 98.7 /100 | #100 | Exceptional 5.3% |
| Menominee | 98.7 /100 | #101 | Exceptional 5.3% |
| Nicaraguans | 98.6 /100 | #102 | Exceptional 5.3% |
| Salvadorans | 98.6 /100 | #103 | Exceptional 5.3% |
| Peruvians | 98.5 /100 | #104 | Exceptional 5.3% |
| Immigrants | Italy | 98.4 /100 | #105 | Exceptional 5.3% |
| Immigrants | Yemen | 98.2 /100 | #106 | Exceptional 5.3% |
| Russians | 98.2 /100 | #107 | Exceptional 5.3% |
| Immigrants | South Africa | 98.1 /100 | #108 | Exceptional 5.3% |
| Immigrants | Northern Africa | 98.1 /100 | #109 | Exceptional 5.3% |
| Immigrants | Eritrea | 98.0 /100 | #110 | Exceptional 5.3% |
| Ethiopians | 97.9 /100 | #111 | Exceptional 5.3% |
| Immigrants | Latvia | 97.9 /100 | #112 | Exceptional 5.3% |
| Aleuts | 97.8 /100 | #113 | Exceptional 5.3% |
| Immigrants | Northern Europe | 97.8 /100 | #114 | Exceptional 5.3% |
Demographics Similar to Ghanaians by Disability Age 5 to 17
In terms of disability age 5 to 17, the demographic groups most similar to Ghanaians are Bangladeshi (5.8%, a difference of 0.010%), Haitian (5.8%, a difference of 0.020%), European (5.8%, a difference of 0.070%), Swiss (5.8%, a difference of 0.10%), and British West Indian (5.8%, a difference of 0.18%).
| Demographics | Rating | Rank | Disability Age 5 to 17 |
| Alsatians | 6.0 /100 | #223 | Tragic 5.8% |
| Mexicans | 5.7 /100 | #224 | Tragic 5.8% |
| Guamanians/Chamorros | 5.6 /100 | #225 | Tragic 5.8% |
| British West Indians | 5.4 /100 | #226 | Tragic 5.8% |
| Swiss | 5.1 /100 | #227 | Tragic 5.8% |
| Haitians | 4.8 /100 | #228 | Tragic 5.8% |
| Bangladeshis | 4.8 /100 | #229 | Tragic 5.8% |
| Ghanaians | 4.7 /100 | #230 | Tragic 5.8% |
| Europeans | 4.5 /100 | #231 | Tragic 5.8% |
| Immigrants | Laos | 3.8 /100 | #232 | Tragic 5.8% |
| Immigrants | West Indies | 3.5 /100 | #233 | Tragic 5.8% |
| Immigrants | Kenya | 3.4 /100 | #234 | Tragic 5.8% |
| Malaysians | 3.4 /100 | #235 | Tragic 5.8% |
| Immigrants | Brazil | 3.2 /100 | #236 | Tragic 5.8% |
| Sudanese | 2.9 /100 | #237 | Tragic 5.8% |