Macedonian vs Ghanaian Disability Age 5 to 17
COMPARE
Macedonian
Ghanaian
Disability Age 5 to 17
Disability Age 5 to 17 Comparison
Macedonians
Ghanaians
5.2%
DISABILITY AGE 5 TO 17
99.8/ 100
METRIC RATING
67th/ 347
METRIC RANK
5.8%
DISABILITY AGE 5 TO 17
4.7/ 100
METRIC RATING
230th/ 347
METRIC RANK
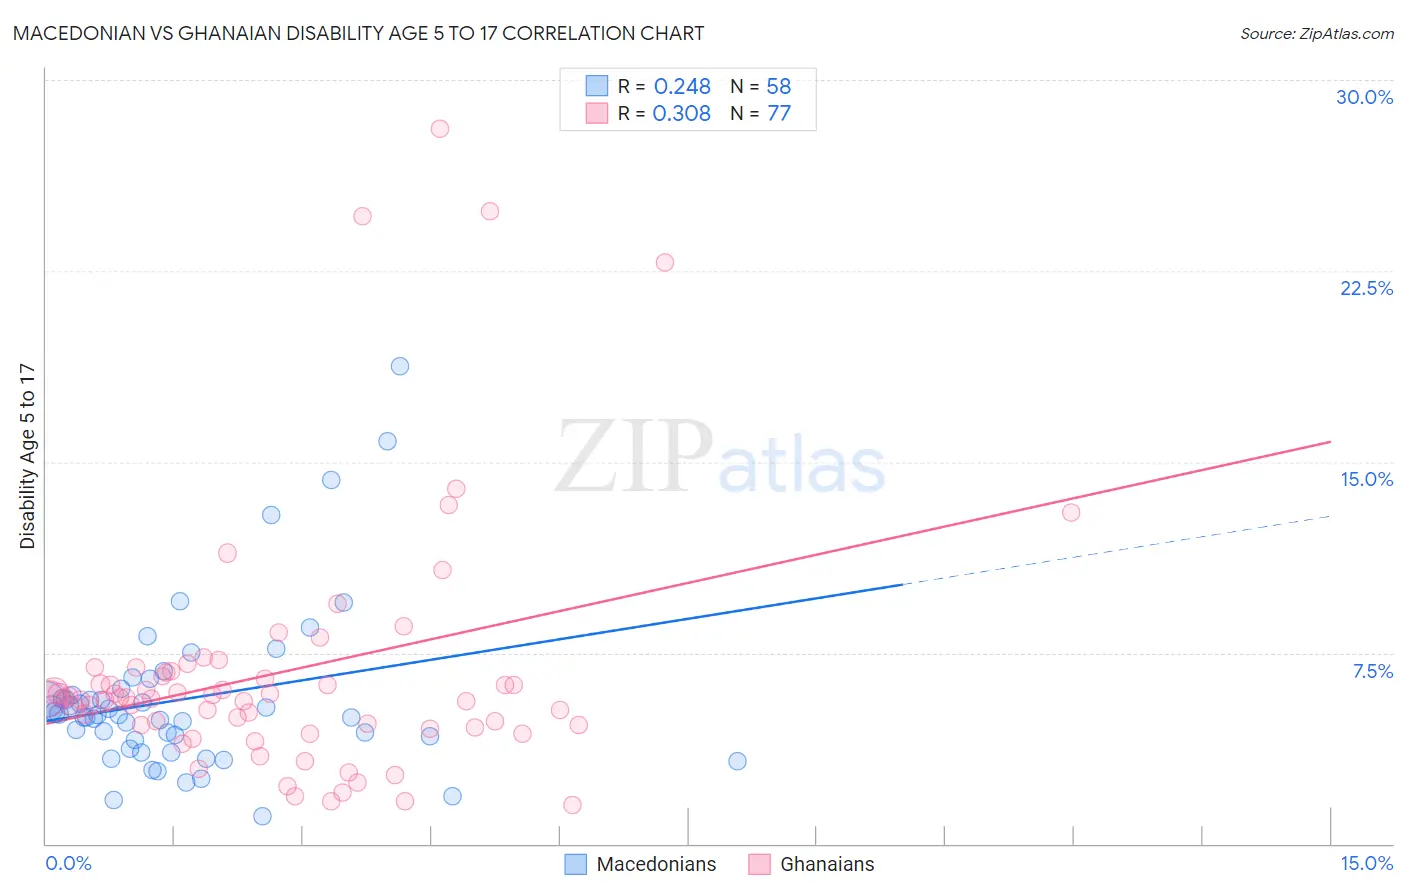
Macedonian vs Ghanaian Disability Age 5 to 17 Correlation Chart
The statistical analysis conducted on geographies consisting of 132,067,299 people shows a weak positive correlation between the proportion of Macedonians and percentage of population with a disability between the ages 5 and 17 in the United States with a correlation coefficient (R) of 0.248 and weighted average of 5.2%. Similarly, the statistical analysis conducted on geographies consisting of 189,962,788 people shows a mild positive correlation between the proportion of Ghanaians and percentage of population with a disability between the ages 5 and 17 in the United States with a correlation coefficient (R) of 0.308 and weighted average of 5.8%, a difference of 12.1%.
Disability Age 5 to 17 Correlation Summary
| Measurement | Macedonian | Ghanaian |
| Minimum | 1.1% | 1.5% |
| Maximum | 18.8% | 28.1% |
| Range | 17.7% | 26.6% |
| Mean | 5.7% | 6.7% |
| Median | 5.1% | 5.7% |
| Interquartile 25% (IQ1) | 4.1% | 4.6% |
| Interquartile 75% (IQ3) | 5.9% | 6.8% |
| Interquartile Range (IQR) | 1.8% | 2.1% |
| Standard Deviation (Sample) | 3.2% | 5.0% |
| Standard Deviation (Population) | 3.2% | 4.9% |
Similar Demographics by Disability Age 5 to 17
Demographics Similar to Macedonians by Disability Age 5 to 17
In terms of disability age 5 to 17, the demographic groups most similar to Macedonians are Palestinian (5.2%, a difference of 0.030%), Immigrants from Greece (5.2%, a difference of 0.070%), Immigrants from South Eastern Asia (5.2%, a difference of 0.080%), Immigrants from Bangladesh (5.2%, a difference of 0.11%), and Immigrants from Syria (5.2%, a difference of 0.14%).
| Demographics | Rating | Rank | Disability Age 5 to 17 |
| Immigrants | Eastern Europe | 99.9 /100 | #60 | Exceptional 5.1% |
| Immigrants | Switzerland | 99.8 /100 | #61 | Exceptional 5.2% |
| Immigrants | Ireland | 99.8 /100 | #62 | Exceptional 5.2% |
| Immigrants | Bangladesh | 99.8 /100 | #63 | Exceptional 5.2% |
| Immigrants | South Eastern Asia | 99.8 /100 | #64 | Exceptional 5.2% |
| Immigrants | Greece | 99.8 /100 | #65 | Exceptional 5.2% |
| Palestinians | 99.8 /100 | #66 | Exceptional 5.2% |
| Macedonians | 99.8 /100 | #67 | Exceptional 5.2% |
| Immigrants | Syria | 99.7 /100 | #68 | Exceptional 5.2% |
| Guyanese | 99.7 /100 | #69 | Exceptional 5.2% |
| Immigrants | Belgium | 99.7 /100 | #70 | Exceptional 5.2% |
| Jordanians | 99.7 /100 | #71 | Exceptional 5.2% |
| Immigrants | Vietnam | 99.7 /100 | #72 | Exceptional 5.2% |
| Immigrants | Czechoslovakia | 99.7 /100 | #73 | Exceptional 5.2% |
| Immigrants | Romania | 99.7 /100 | #74 | Exceptional 5.2% |
Demographics Similar to Ghanaians by Disability Age 5 to 17
In terms of disability age 5 to 17, the demographic groups most similar to Ghanaians are Bangladeshi (5.8%, a difference of 0.010%), Haitian (5.8%, a difference of 0.020%), European (5.8%, a difference of 0.070%), Swiss (5.8%, a difference of 0.10%), and British West Indian (5.8%, a difference of 0.18%).
| Demographics | Rating | Rank | Disability Age 5 to 17 |
| Alsatians | 6.0 /100 | #223 | Tragic 5.8% |
| Mexicans | 5.7 /100 | #224 | Tragic 5.8% |
| Guamanians/Chamorros | 5.6 /100 | #225 | Tragic 5.8% |
| British West Indians | 5.4 /100 | #226 | Tragic 5.8% |
| Swiss | 5.1 /100 | #227 | Tragic 5.8% |
| Haitians | 4.8 /100 | #228 | Tragic 5.8% |
| Bangladeshis | 4.8 /100 | #229 | Tragic 5.8% |
| Ghanaians | 4.7 /100 | #230 | Tragic 5.8% |
| Europeans | 4.5 /100 | #231 | Tragic 5.8% |
| Immigrants | Laos | 3.8 /100 | #232 | Tragic 5.8% |
| Immigrants | West Indies | 3.5 /100 | #233 | Tragic 5.8% |
| Immigrants | Kenya | 3.4 /100 | #234 | Tragic 5.8% |
| Malaysians | 3.4 /100 | #235 | Tragic 5.8% |
| Immigrants | Brazil | 3.2 /100 | #236 | Tragic 5.8% |
| Sudanese | 2.9 /100 | #237 | Tragic 5.8% |