Ute vs Ghanaian Disability Age 5 to 17
COMPARE
Ute
Ghanaian
Disability Age 5 to 17
Disability Age 5 to 17 Comparison
Ute
Ghanaians
5.5%
DISABILITY AGE 5 TO 17
80.6/ 100
METRIC RATING
152nd/ 347
METRIC RANK
5.8%
DISABILITY AGE 5 TO 17
4.7/ 100
METRIC RATING
230th/ 347
METRIC RANK
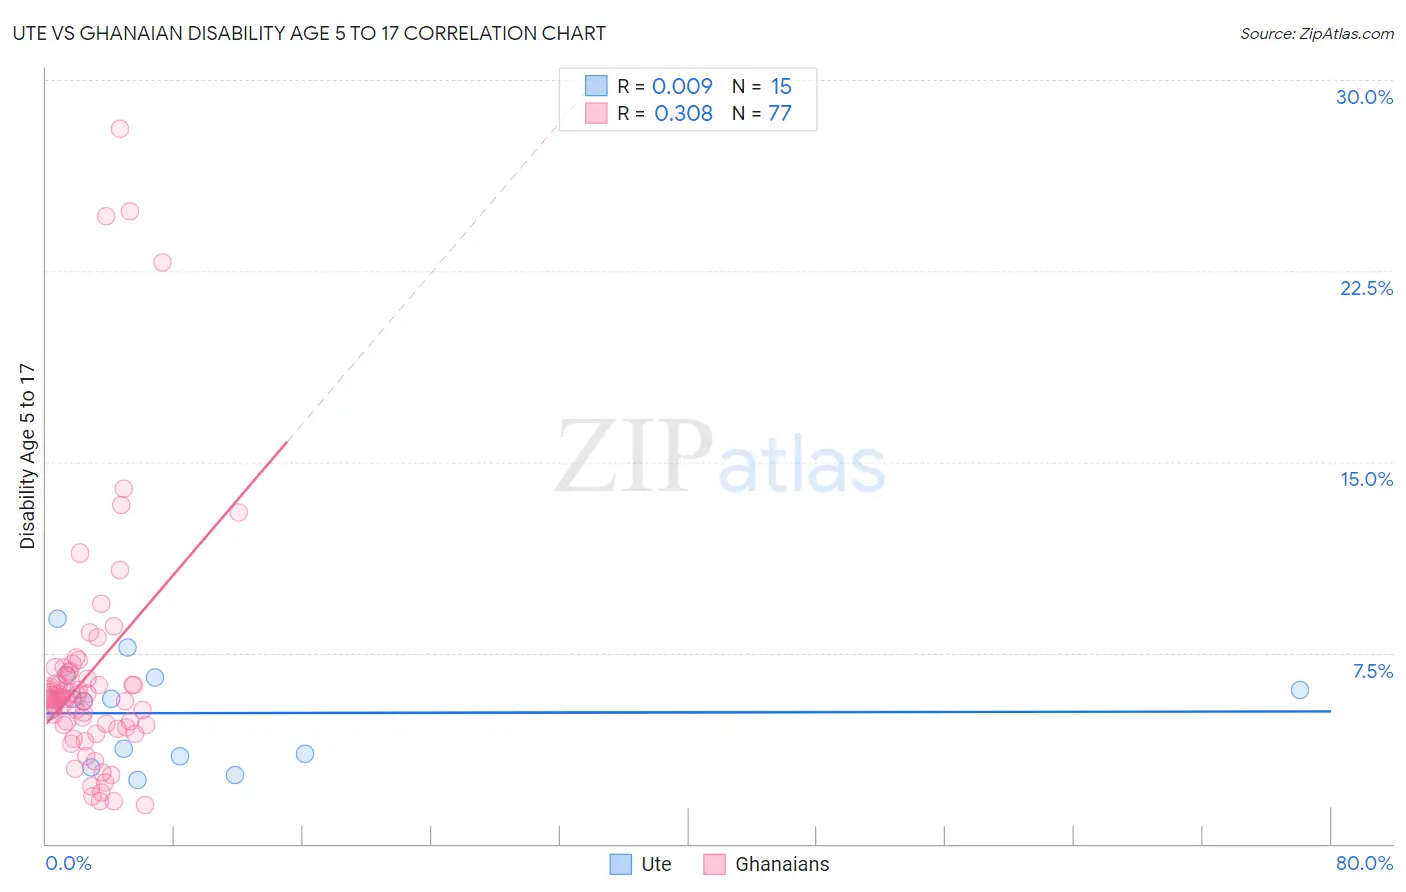
Ute vs Ghanaian Disability Age 5 to 17 Correlation Chart
The statistical analysis conducted on geographies consisting of 55,569,017 people shows no correlation between the proportion of Ute and percentage of population with a disability between the ages 5 and 17 in the United States with a correlation coefficient (R) of 0.009 and weighted average of 5.5%. Similarly, the statistical analysis conducted on geographies consisting of 189,962,788 people shows a mild positive correlation between the proportion of Ghanaians and percentage of population with a disability between the ages 5 and 17 in the United States with a correlation coefficient (R) of 0.308 and weighted average of 5.8%, a difference of 5.6%.
Disability Age 5 to 17 Correlation Summary
| Measurement | Ute | Ghanaian |
| Minimum | 2.5% | 1.5% |
| Maximum | 8.8% | 28.1% |
| Range | 6.3% | 26.6% |
| Mean | 5.1% | 6.7% |
| Median | 5.6% | 5.7% |
| Interquartile 25% (IQ1) | 3.4% | 4.6% |
| Interquartile 75% (IQ3) | 6.5% | 6.8% |
| Interquartile Range (IQR) | 3.1% | 2.1% |
| Standard Deviation (Sample) | 1.9% | 5.0% |
| Standard Deviation (Population) | 1.8% | 4.9% |
Similar Demographics by Disability Age 5 to 17
Demographics Similar to Ute by Disability Age 5 to 17
In terms of disability age 5 to 17, the demographic groups most similar to Ute are Estonian (5.5%, a difference of 0.010%), Guatemalan (5.5%, a difference of 0.070%), Ecuadorian (5.5%, a difference of 0.070%), Central American (5.5%, a difference of 0.080%), and Samoan (5.5%, a difference of 0.11%).
| Demographics | Rating | Rank | Disability Age 5 to 17 |
| Immigrants | Guatemala | 86.6 /100 | #145 | Excellent 5.5% |
| Albanians | 83.7 /100 | #146 | Excellent 5.5% |
| Immigrants | Albania | 83.1 /100 | #147 | Excellent 5.5% |
| Samoans | 81.9 /100 | #148 | Excellent 5.5% |
| Central Americans | 81.6 /100 | #149 | Excellent 5.5% |
| Guatemalans | 81.5 /100 | #150 | Excellent 5.5% |
| Estonians | 80.8 /100 | #151 | Excellent 5.5% |
| Ute | 80.6 /100 | #152 | Excellent 5.5% |
| Ecuadorians | 79.7 /100 | #153 | Good 5.5% |
| Australians | 78.8 /100 | #154 | Good 5.5% |
| Immigrants | Ecuador | 78.3 /100 | #155 | Good 5.5% |
| Hawaiians | 78.0 /100 | #156 | Good 5.5% |
| Immigrants | Costa Rica | 77.9 /100 | #157 | Good 5.5% |
| Immigrants | Nepal | 77.1 /100 | #158 | Good 5.5% |
| Immigrants | Zimbabwe | 75.3 /100 | #159 | Good 5.5% |
Demographics Similar to Ghanaians by Disability Age 5 to 17
In terms of disability age 5 to 17, the demographic groups most similar to Ghanaians are Bangladeshi (5.8%, a difference of 0.010%), Haitian (5.8%, a difference of 0.020%), European (5.8%, a difference of 0.070%), Swiss (5.8%, a difference of 0.10%), and British West Indian (5.8%, a difference of 0.18%).
| Demographics | Rating | Rank | Disability Age 5 to 17 |
| Alsatians | 6.0 /100 | #223 | Tragic 5.8% |
| Mexicans | 5.7 /100 | #224 | Tragic 5.8% |
| Guamanians/Chamorros | 5.6 /100 | #225 | Tragic 5.8% |
| British West Indians | 5.4 /100 | #226 | Tragic 5.8% |
| Swiss | 5.1 /100 | #227 | Tragic 5.8% |
| Haitians | 4.8 /100 | #228 | Tragic 5.8% |
| Bangladeshis | 4.8 /100 | #229 | Tragic 5.8% |
| Ghanaians | 4.7 /100 | #230 | Tragic 5.8% |
| Europeans | 4.5 /100 | #231 | Tragic 5.8% |
| Immigrants | Laos | 3.8 /100 | #232 | Tragic 5.8% |
| Immigrants | West Indies | 3.5 /100 | #233 | Tragic 5.8% |
| Immigrants | Kenya | 3.4 /100 | #234 | Tragic 5.8% |
| Malaysians | 3.4 /100 | #235 | Tragic 5.8% |
| Immigrants | Brazil | 3.2 /100 | #236 | Tragic 5.8% |
| Sudanese | 2.9 /100 | #237 | Tragic 5.8% |