Immigrants from Burma/Myanmar vs Iranian Receiving Food Stamps
COMPARE
Immigrants from Burma/Myanmar
Iranian
Receiving Food Stamps
Receiving Food Stamps Comparison
Immigrants from Burma/Myanmar
Iranians
12.9%
RECEIVING FOOD STAMPS
6.0/ 100
METRIC RATING
217th/ 347
METRIC RANK
7.9%
RECEIVING FOOD STAMPS
100.0/ 100
METRIC RATING
4th/ 347
METRIC RANK
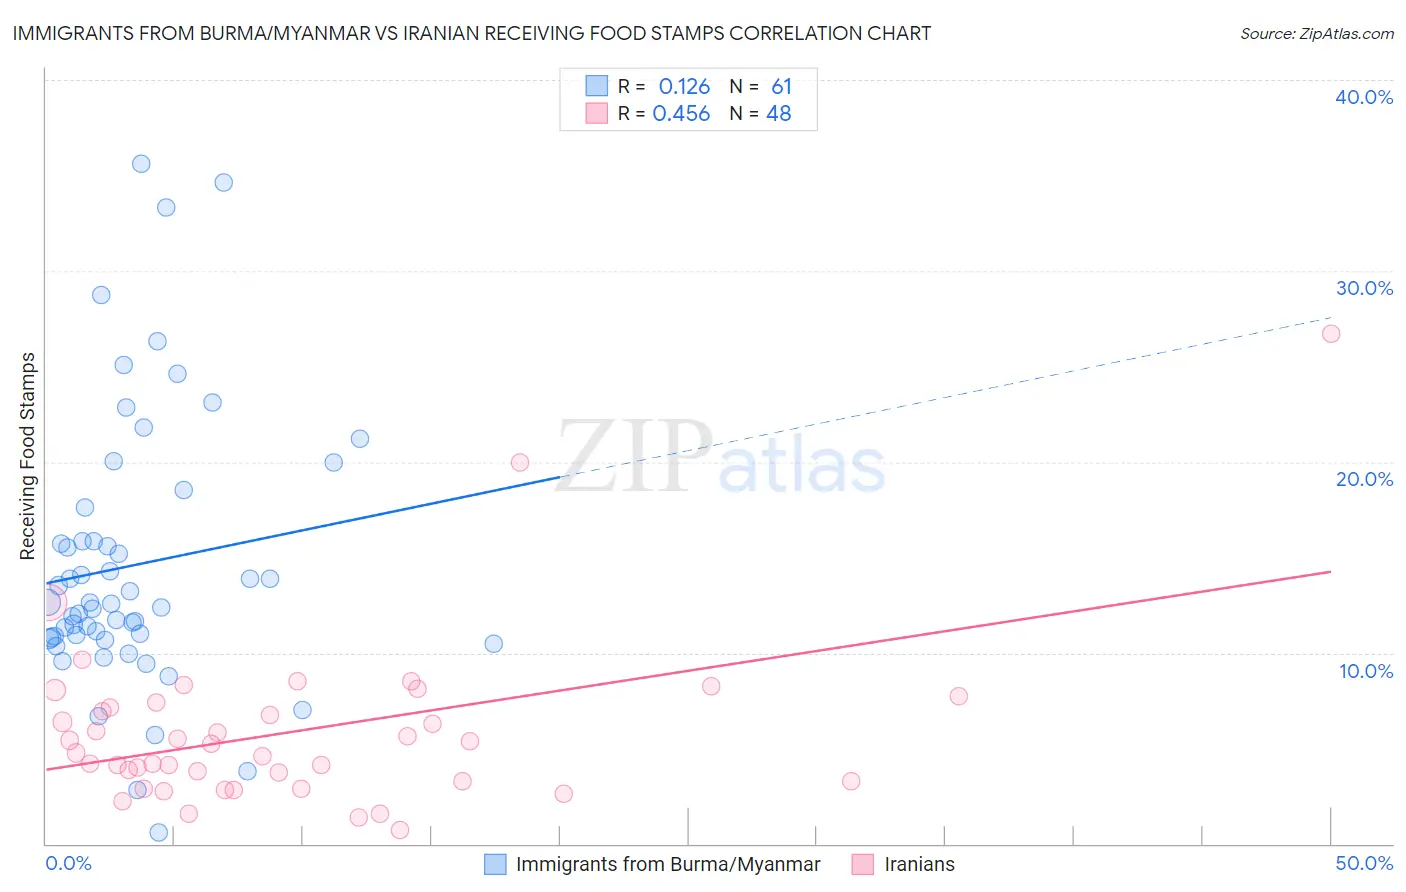
Immigrants from Burma/Myanmar vs Iranian Receiving Food Stamps Correlation Chart
The statistical analysis conducted on geographies consisting of 172,104,421 people shows a poor positive correlation between the proportion of Immigrants from Burma/Myanmar and percentage of population receiving government assistance and/or food stamps in the United States with a correlation coefficient (R) of 0.126 and weighted average of 12.9%. Similarly, the statistical analysis conducted on geographies consisting of 315,912,646 people shows a moderate positive correlation between the proportion of Iranians and percentage of population receiving government assistance and/or food stamps in the United States with a correlation coefficient (R) of 0.456 and weighted average of 7.9%, a difference of 62.2%.
Receiving Food Stamps Correlation Summary
| Measurement | Immigrants from Burma/Myanmar | Iranian |
| Minimum | 0.60% | 0.70% |
| Maximum | 35.6% | 26.7% |
| Range | 35.0% | 26.0% |
| Mean | 14.6% | 5.9% |
| Median | 12.5% | 5.0% |
| Interquartile 25% (IQ1) | 10.8% | 3.3% |
| Interquartile 75% (IQ3) | 16.7% | 7.3% |
| Interquartile Range (IQR) | 6.0% | 4.0% |
| Standard Deviation (Sample) | 7.2% | 4.5% |
| Standard Deviation (Population) | 7.1% | 4.4% |
Similar Demographics by Receiving Food Stamps
Demographics Similar to Immigrants from Burma/Myanmar by Receiving Food Stamps
In terms of receiving food stamps, the demographic groups most similar to Immigrants from Burma/Myanmar are Immigrants from South America (12.8%, a difference of 0.26%), Native Hawaiian (12.8%, a difference of 0.36%), Hawaiian (12.9%, a difference of 0.37%), Immigrants from Middle Africa (12.9%, a difference of 0.38%), and Immigrants from Colombia (12.9%, a difference of 0.41%).
| Demographics | Rating | Rank | Receiving Food Stamps |
| Immigrants | Uruguay | 12.8 /100 | #210 | Poor 12.5% |
| Colombians | 10.2 /100 | #211 | Poor 12.6% |
| Malaysians | 8.5 /100 | #212 | Tragic 12.7% |
| Moroccans | 7.6 /100 | #213 | Tragic 12.8% |
| Immigrants | Africa | 7.6 /100 | #214 | Tragic 12.8% |
| Native Hawaiians | 6.7 /100 | #215 | Tragic 12.8% |
| Immigrants | South America | 6.5 /100 | #216 | Tragic 12.8% |
| Immigrants | Burma/Myanmar | 6.0 /100 | #217 | Tragic 12.9% |
| Hawaiians | 5.4 /100 | #218 | Tragic 12.9% |
| Immigrants | Middle Africa | 5.4 /100 | #219 | Tragic 12.9% |
| Immigrants | Colombia | 5.3 /100 | #220 | Tragic 12.9% |
| Bermudans | 4.8 /100 | #221 | Tragic 13.0% |
| Immigrants | Immigrants | 4.4 /100 | #222 | Tragic 13.0% |
| Immigrants | Albania | 4.4 /100 | #223 | Tragic 13.0% |
| Immigrants | Armenia | 4.3 /100 | #224 | Tragic 13.0% |
Demographics Similar to Iranians by Receiving Food Stamps
In terms of receiving food stamps, the demographic groups most similar to Iranians are Thai (8.1%, a difference of 2.3%), Immigrants from Singapore (8.3%, a difference of 4.6%), Immigrants from Iran (8.3%, a difference of 5.2%), Filipino (7.4%, a difference of 7.3%), and Immigrants from India (7.4%, a difference of 7.6%).
| Demographics | Rating | Rank | Receiving Food Stamps |
| Immigrants | Taiwan | 100.0 /100 | #1 | Exceptional 7.3% |
| Immigrants | India | 100.0 /100 | #2 | Exceptional 7.4% |
| Filipinos | 100.0 /100 | #3 | Exceptional 7.4% |
| Iranians | 100.0 /100 | #4 | Exceptional 7.9% |
| Thais | 100.0 /100 | #5 | Exceptional 8.1% |
| Immigrants | Singapore | 100.0 /100 | #6 | Exceptional 8.3% |
| Immigrants | Iran | 100.0 /100 | #7 | Exceptional 8.3% |
| Burmese | 99.9 /100 | #8 | Exceptional 8.6% |
| Immigrants | Korea | 99.9 /100 | #9 | Exceptional 8.7% |
| Immigrants | South Central Asia | 99.9 /100 | #10 | Exceptional 8.8% |
| Okinawans | 99.9 /100 | #11 | Exceptional 8.9% |
| Cypriots | 99.9 /100 | #12 | Exceptional 8.9% |
| Bulgarians | 99.9 /100 | #13 | Exceptional 8.9% |
| Maltese | 99.9 /100 | #14 | Exceptional 8.9% |
| Norwegians | 99.9 /100 | #15 | Exceptional 9.0% |