Immigrants from Burma/Myanmar vs Iranian Disability Age 35 to 64
COMPARE
Immigrants from Burma/Myanmar
Iranian
Disability Age 35 to 64
Disability Age 35 to 64 Comparison
Immigrants from Burma/Myanmar
Iranians
12.3%
DISABILITY AGE 35 TO 64
1.2/ 100
METRIC RATING
250th/ 347
METRIC RANK
8.7%
DISABILITY AGE 35 TO 64
100.0/ 100
METRIC RATING
8th/ 347
METRIC RANK
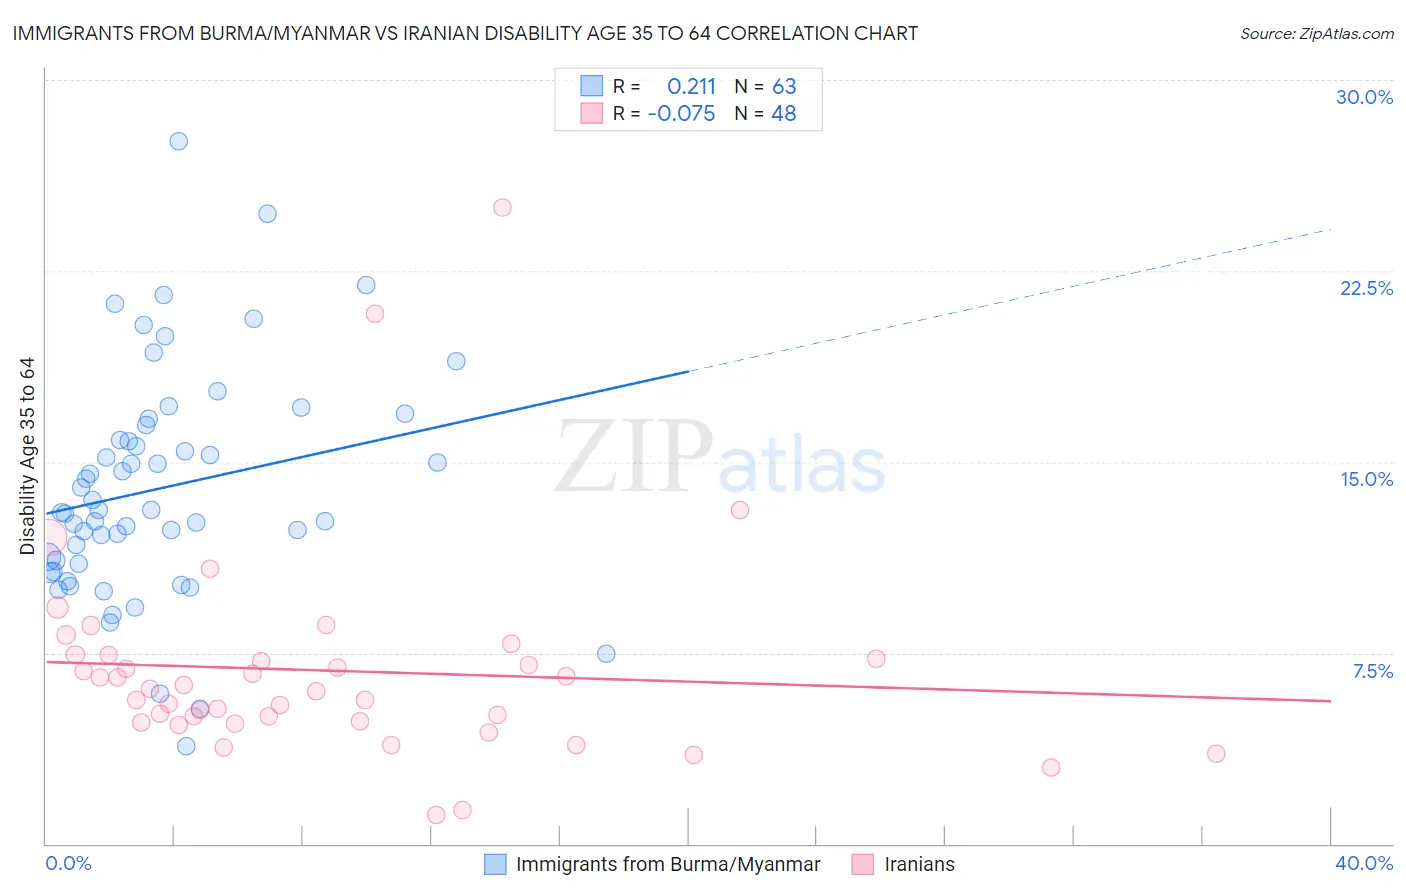
Immigrants from Burma/Myanmar vs Iranian Disability Age 35 to 64 Correlation Chart
The statistical analysis conducted on geographies consisting of 172,272,577 people shows a weak positive correlation between the proportion of Immigrants from Burma/Myanmar and percentage of population with a disability between the ages 34 and 64 in the United States with a correlation coefficient (R) of 0.211 and weighted average of 12.3%. Similarly, the statistical analysis conducted on geographies consisting of 316,627,091 people shows a slight negative correlation between the proportion of Iranians and percentage of population with a disability between the ages 34 and 64 in the United States with a correlation coefficient (R) of -0.075 and weighted average of 8.7%, a difference of 41.7%.
Disability Age 35 to 64 Correlation Summary
| Measurement | Immigrants from Burma/Myanmar | Iranian |
| Minimum | 3.9% | 1.1% |
| Maximum | 27.6% | 25.0% |
| Range | 23.7% | 23.9% |
| Mean | 14.0% | 6.8% |
| Median | 13.1% | 6.0% |
| Interquartile 25% (IQ1) | 11.0% | 4.8% |
| Interquartile 75% (IQ3) | 16.5% | 7.3% |
| Interquartile Range (IQR) | 5.5% | 2.5% |
| Standard Deviation (Sample) | 4.5% | 4.1% |
| Standard Deviation (Population) | 4.5% | 4.1% |
Similar Demographics by Disability Age 35 to 64
Demographics Similar to Immigrants from Burma/Myanmar by Disability Age 35 to 64
In terms of disability age 35 to 64, the demographic groups most similar to Immigrants from Burma/Myanmar are German (12.3%, a difference of 0.080%), Hispanic or Latino (12.3%, a difference of 0.13%), Spaniard (12.3%, a difference of 0.16%), Immigrants from Senegal (12.2%, a difference of 0.26%), and Guamanian/Chamorro (12.2%, a difference of 0.29%).
| Demographics | Rating | Rank | Disability Age 35 to 64 |
| Slovaks | 2.7 /100 | #243 | Tragic 12.1% |
| Finns | 2.3 /100 | #244 | Tragic 12.1% |
| Immigrants | Mexico | 2.2 /100 | #245 | Tragic 12.1% |
| Guamanians/Chamorros | 1.4 /100 | #246 | Tragic 12.2% |
| Immigrants | Senegal | 1.3 /100 | #247 | Tragic 12.2% |
| Spaniards | 1.3 /100 | #248 | Tragic 12.3% |
| Hispanics or Latinos | 1.3 /100 | #249 | Tragic 12.3% |
| Immigrants | Burma/Myanmar | 1.2 /100 | #250 | Tragic 12.3% |
| Germans | 1.1 /100 | #251 | Tragic 12.3% |
| Irish | 1.0 /100 | #252 | Tragic 12.3% |
| Dutch | 1.0 /100 | #253 | Tragic 12.3% |
| Hawaiians | 0.9 /100 | #254 | Tragic 12.3% |
| Japanese | 0.8 /100 | #255 | Tragic 12.3% |
| Scottish | 0.8 /100 | #256 | Tragic 12.4% |
| Mexicans | 0.7 /100 | #257 | Tragic 12.4% |
Demographics Similar to Iranians by Disability Age 35 to 64
In terms of disability age 35 to 64, the demographic groups most similar to Iranians are Immigrants from China (8.7%, a difference of 0.43%), Immigrants from Israel (8.6%, a difference of 0.58%), Immigrants from Bolivia (8.7%, a difference of 0.70%), Thai (8.6%, a difference of 1.0%), and Immigrants from Eastern Asia (8.8%, a difference of 1.4%).
| Demographics | Rating | Rank | Disability Age 35 to 64 |
| Immigrants | Taiwan | 100.0 /100 | #1 | Exceptional 7.8% |
| Filipinos | 100.0 /100 | #2 | Exceptional 8.0% |
| Immigrants | Hong Kong | 100.0 /100 | #3 | Exceptional 8.2% |
| Immigrants | India | 100.0 /100 | #4 | Exceptional 8.3% |
| Immigrants | Iran | 100.0 /100 | #5 | Exceptional 8.5% |
| Thais | 100.0 /100 | #6 | Exceptional 8.6% |
| Immigrants | Israel | 100.0 /100 | #7 | Exceptional 8.6% |
| Iranians | 100.0 /100 | #8 | Exceptional 8.7% |
| Immigrants | China | 100.0 /100 | #9 | Exceptional 8.7% |
| Immigrants | Bolivia | 100.0 /100 | #10 | Exceptional 8.7% |
| Immigrants | Eastern Asia | 100.0 /100 | #11 | Exceptional 8.8% |
| Indians (Asian) | 100.0 /100 | #12 | Exceptional 8.9% |
| Immigrants | South Central Asia | 100.0 /100 | #13 | Exceptional 8.9% |
| Immigrants | Singapore | 100.0 /100 | #14 | Exceptional 8.9% |
| Bolivians | 100.0 /100 | #15 | Exceptional 8.9% |