Immigrants from Italy vs Indonesian Disability Age 5 to 17
COMPARE
Immigrants from Italy
Indonesian
Disability Age 5 to 17
Disability Age 5 to 17 Comparison
Immigrants from Italy
Indonesians
5.3%
DISABILITY AGE 5 TO 17
98.4/ 100
METRIC RATING
105th/ 347
METRIC RANK
5.9%
DISABILITY AGE 5 TO 17
2.0/ 100
METRIC RATING
243rd/ 347
METRIC RANK
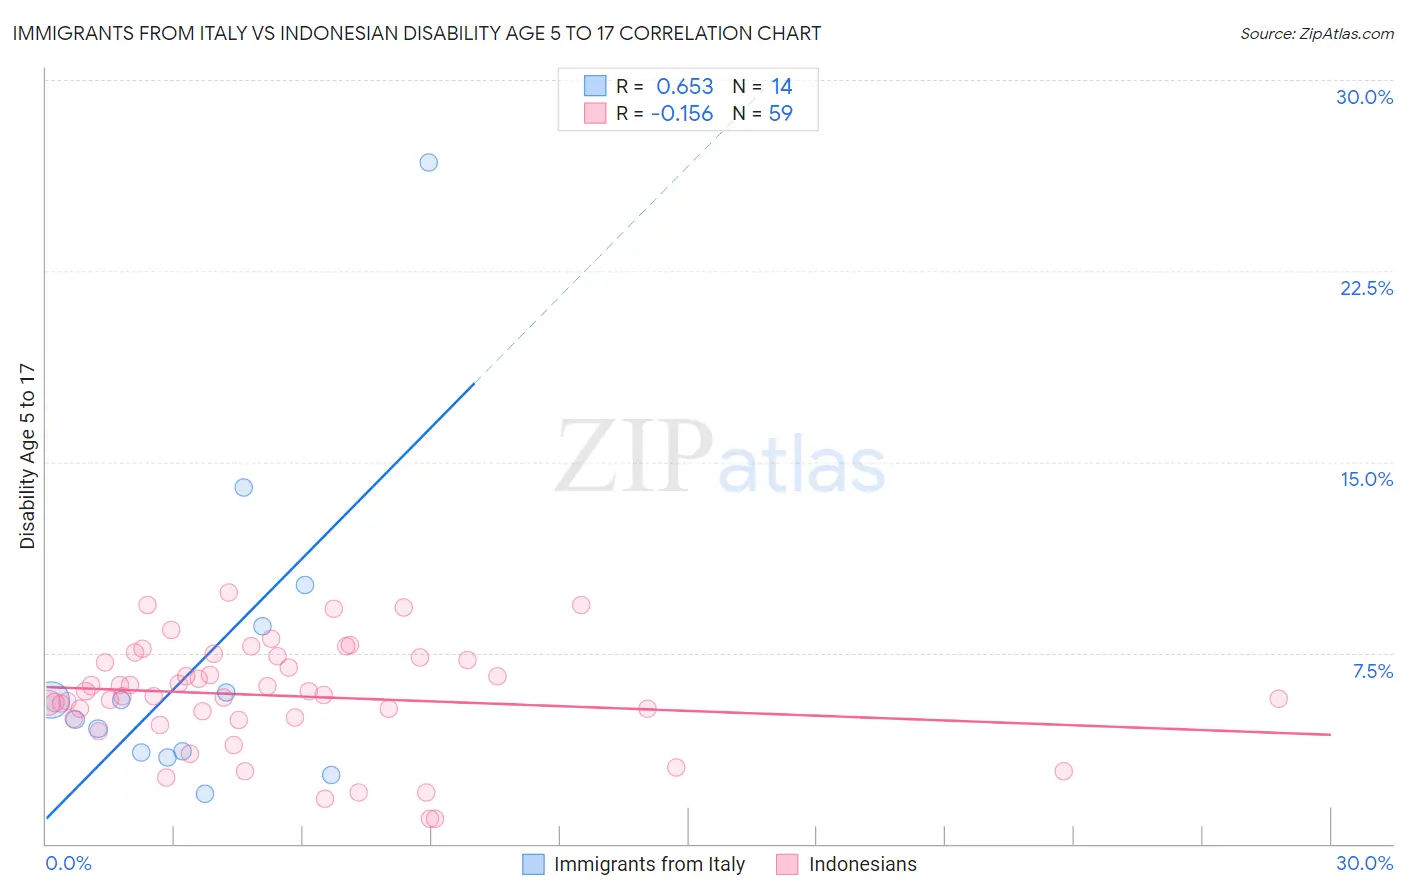
Immigrants from Italy vs Indonesian Disability Age 5 to 17 Correlation Chart
The statistical analysis conducted on geographies consisting of 321,280,380 people shows a significant positive correlation between the proportion of Immigrants from Italy and percentage of population with a disability between the ages 5 and 17 in the United States with a correlation coefficient (R) of 0.653 and weighted average of 5.3%. Similarly, the statistical analysis conducted on geographies consisting of 162,352,811 people shows a poor negative correlation between the proportion of Indonesians and percentage of population with a disability between the ages 5 and 17 in the United States with a correlation coefficient (R) of -0.156 and weighted average of 5.9%, a difference of 10.4%.
Disability Age 5 to 17 Correlation Summary
| Measurement | Immigrants from Italy | Indonesian |
| Minimum | 2.0% | 0.98% |
| Maximum | 26.8% | 9.9% |
| Range | 24.8% | 8.9% |
| Mean | 7.2% | 5.8% |
| Median | 5.3% | 5.8% |
| Interquartile 25% (IQ1) | 3.6% | 4.9% |
| Interquartile 75% (IQ3) | 8.6% | 7.3% |
| Interquartile Range (IQR) | 5.0% | 2.4% |
| Standard Deviation (Sample) | 6.5% | 2.1% |
| Standard Deviation (Population) | 6.3% | 2.1% |
Similar Demographics by Disability Age 5 to 17
Demographics Similar to Immigrants from Italy by Disability Age 5 to 17
In terms of disability age 5 to 17, the demographic groups most similar to Immigrants from Italy are Peruvian (5.3%, a difference of 0.090%), Immigrants from Yemen (5.3%, a difference of 0.13%), Russian (5.3%, a difference of 0.16%), Salvadoran (5.3%, a difference of 0.17%), and Nicaraguan (5.3%, a difference of 0.19%).
| Demographics | Rating | Rank | Disability Age 5 to 17 |
| Immigrants | Austria | 98.9 /100 | #98 | Exceptional 5.3% |
| Cambodians | 98.8 /100 | #99 | Exceptional 5.3% |
| Nepalese | 98.7 /100 | #100 | Exceptional 5.3% |
| Menominee | 98.7 /100 | #101 | Exceptional 5.3% |
| Nicaraguans | 98.6 /100 | #102 | Exceptional 5.3% |
| Salvadorans | 98.6 /100 | #103 | Exceptional 5.3% |
| Peruvians | 98.5 /100 | #104 | Exceptional 5.3% |
| Immigrants | Italy | 98.4 /100 | #105 | Exceptional 5.3% |
| Immigrants | Yemen | 98.2 /100 | #106 | Exceptional 5.3% |
| Russians | 98.2 /100 | #107 | Exceptional 5.3% |
| Immigrants | South Africa | 98.1 /100 | #108 | Exceptional 5.3% |
| Immigrants | Northern Africa | 98.1 /100 | #109 | Exceptional 5.3% |
| Immigrants | Eritrea | 98.0 /100 | #110 | Exceptional 5.3% |
| Ethiopians | 97.9 /100 | #111 | Exceptional 5.3% |
| Immigrants | Latvia | 97.9 /100 | #112 | Exceptional 5.3% |
Demographics Similar to Indonesians by Disability Age 5 to 17
In terms of disability age 5 to 17, the demographic groups most similar to Indonesians are Spaniard (5.9%, a difference of 0.010%), Immigrants from Germany (5.9%, a difference of 0.060%), Immigrants from Micronesia (5.9%, a difference of 0.060%), Tlingit-Haida (5.9%, a difference of 0.060%), and Immigrants from Caribbean (5.9%, a difference of 0.090%).
| Demographics | Rating | Rank | Disability Age 5 to 17 |
| Immigrants | Brazil | 3.2 /100 | #236 | Tragic 5.8% |
| Sudanese | 2.9 /100 | #237 | Tragic 5.8% |
| Hungarians | 2.6 /100 | #238 | Tragic 5.8% |
| German Russians | 2.4 /100 | #239 | Tragic 5.9% |
| West Indians | 2.4 /100 | #240 | Tragic 5.9% |
| Immigrants | Caribbean | 2.1 /100 | #241 | Tragic 5.9% |
| Spaniards | 2.0 /100 | #242 | Tragic 5.9% |
| Indonesians | 2.0 /100 | #243 | Tragic 5.9% |
| Immigrants | Germany | 1.9 /100 | #244 | Tragic 5.9% |
| Immigrants | Micronesia | 1.9 /100 | #245 | Tragic 5.9% |
| Tlingit-Haida | 1.9 /100 | #246 | Tragic 5.9% |
| Immigrants | Honduras | 1.8 /100 | #247 | Tragic 5.9% |
| British | 1.7 /100 | #248 | Tragic 5.9% |
| Immigrants | Ghana | 1.7 /100 | #249 | Tragic 5.9% |
| Poles | 1.5 /100 | #250 | Tragic 5.9% |