Maltese vs Indonesian Disability Age 5 to 17
COMPARE
Maltese
Indonesian
Disability Age 5 to 17
Disability Age 5 to 17 Comparison
Maltese
Indonesians
5.4%
DISABILITY AGE 5 TO 17
96.0/ 100
METRIC RATING
121st/ 347
METRIC RANK
5.9%
DISABILITY AGE 5 TO 17
2.0/ 100
METRIC RATING
243rd/ 347
METRIC RANK
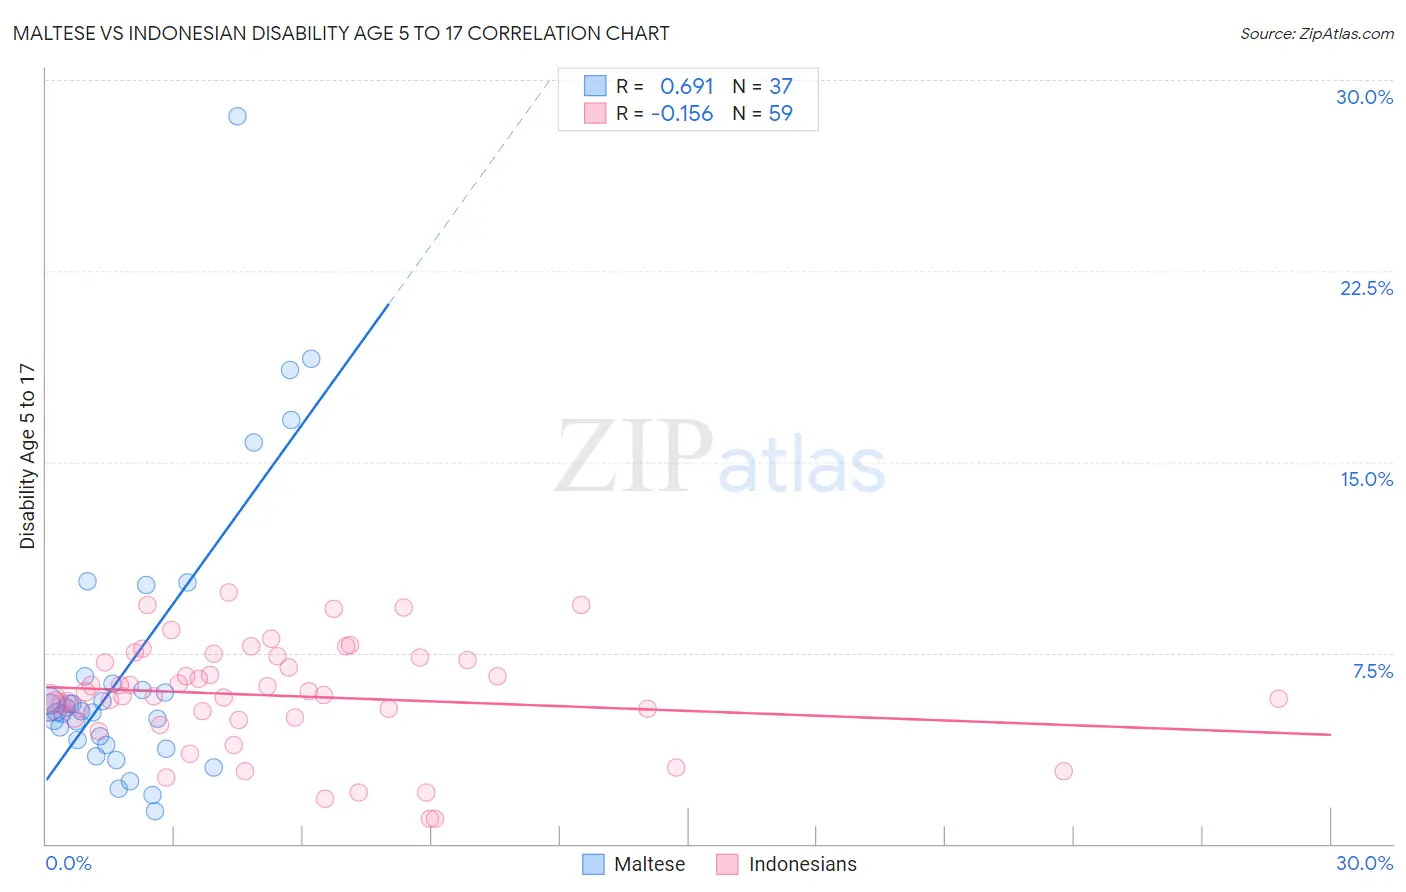
Maltese vs Indonesian Disability Age 5 to 17 Correlation Chart
The statistical analysis conducted on geographies consisting of 125,822,191 people shows a significant positive correlation between the proportion of Maltese and percentage of population with a disability between the ages 5 and 17 in the United States with a correlation coefficient (R) of 0.691 and weighted average of 5.4%. Similarly, the statistical analysis conducted on geographies consisting of 162,352,811 people shows a poor negative correlation between the proportion of Indonesians and percentage of population with a disability between the ages 5 and 17 in the United States with a correlation coefficient (R) of -0.156 and weighted average of 5.9%, a difference of 9.1%.
Disability Age 5 to 17 Correlation Summary
| Measurement | Maltese | Indonesian |
| Minimum | 1.3% | 0.98% |
| Maximum | 28.6% | 9.9% |
| Range | 27.3% | 8.9% |
| Mean | 7.0% | 5.8% |
| Median | 5.2% | 5.8% |
| Interquartile 25% (IQ1) | 4.0% | 4.9% |
| Interquartile 75% (IQ3) | 6.4% | 7.3% |
| Interquartile Range (IQR) | 2.5% | 2.4% |
| Standard Deviation (Sample) | 5.7% | 2.1% |
| Standard Deviation (Population) | 5.6% | 2.1% |
Similar Demographics by Disability Age 5 to 17
Demographics Similar to Maltese by Disability Age 5 to 17
In terms of disability age 5 to 17, the demographic groups most similar to Maltese are Chilean (5.4%, a difference of 0.060%), Immigrants from Ethiopia (5.4%, a difference of 0.16%), Crow (5.4%, a difference of 0.29%), Immigrants from Chile (5.4%, a difference of 0.30%), and New Zealander (5.4%, a difference of 0.31%).
| Demographics | Rating | Rank | Disability Age 5 to 17 |
| Immigrants | Northern Europe | 97.8 /100 | #114 | Exceptional 5.3% |
| Cubans | 97.8 /100 | #115 | Exceptional 5.3% |
| Cypriots | 97.7 /100 | #116 | Exceptional 5.3% |
| Immigrants | Afghanistan | 97.4 /100 | #117 | Exceptional 5.3% |
| South Americans | 97.1 /100 | #118 | Exceptional 5.4% |
| Immigrants | South America | 97.1 /100 | #119 | Exceptional 5.4% |
| Immigrants | Immigrants | 97.0 /100 | #120 | Exceptional 5.4% |
| Maltese | 96.0 /100 | #121 | Exceptional 5.4% |
| Chileans | 95.8 /100 | #122 | Exceptional 5.4% |
| Immigrants | Ethiopia | 95.5 /100 | #123 | Exceptional 5.4% |
| Crow | 95.0 /100 | #124 | Exceptional 5.4% |
| Immigrants | Chile | 95.0 /100 | #125 | Exceptional 5.4% |
| New Zealanders | 95.0 /100 | #126 | Exceptional 5.4% |
| Latvians | 95.0 /100 | #127 | Exceptional 5.4% |
| Immigrants | Venezuela | 94.5 /100 | #128 | Exceptional 5.4% |
Demographics Similar to Indonesians by Disability Age 5 to 17
In terms of disability age 5 to 17, the demographic groups most similar to Indonesians are Spaniard (5.9%, a difference of 0.010%), Immigrants from Germany (5.9%, a difference of 0.060%), Immigrants from Micronesia (5.9%, a difference of 0.060%), Tlingit-Haida (5.9%, a difference of 0.060%), and Immigrants from Caribbean (5.9%, a difference of 0.090%).
| Demographics | Rating | Rank | Disability Age 5 to 17 |
| Immigrants | Brazil | 3.2 /100 | #236 | Tragic 5.8% |
| Sudanese | 2.9 /100 | #237 | Tragic 5.8% |
| Hungarians | 2.6 /100 | #238 | Tragic 5.8% |
| German Russians | 2.4 /100 | #239 | Tragic 5.9% |
| West Indians | 2.4 /100 | #240 | Tragic 5.9% |
| Immigrants | Caribbean | 2.1 /100 | #241 | Tragic 5.9% |
| Spaniards | 2.0 /100 | #242 | Tragic 5.9% |
| Indonesians | 2.0 /100 | #243 | Tragic 5.9% |
| Immigrants | Germany | 1.9 /100 | #244 | Tragic 5.9% |
| Immigrants | Micronesia | 1.9 /100 | #245 | Tragic 5.9% |
| Tlingit-Haida | 1.9 /100 | #246 | Tragic 5.9% |
| Immigrants | Honduras | 1.8 /100 | #247 | Tragic 5.9% |
| British | 1.7 /100 | #248 | Tragic 5.9% |
| Immigrants | Ghana | 1.7 /100 | #249 | Tragic 5.9% |
| Poles | 1.5 /100 | #250 | Tragic 5.9% |