Chilean vs British Disability Age 5 to 17
COMPARE
Chilean
British
Disability Age 5 to 17
Disability Age 5 to 17 Comparison
Chileans
British
5.4%
DISABILITY AGE 5 TO 17
95.8/ 100
METRIC RATING
122nd/ 347
METRIC RANK
5.9%
DISABILITY AGE 5 TO 17
1.7/ 100
METRIC RATING
248th/ 347
METRIC RANK
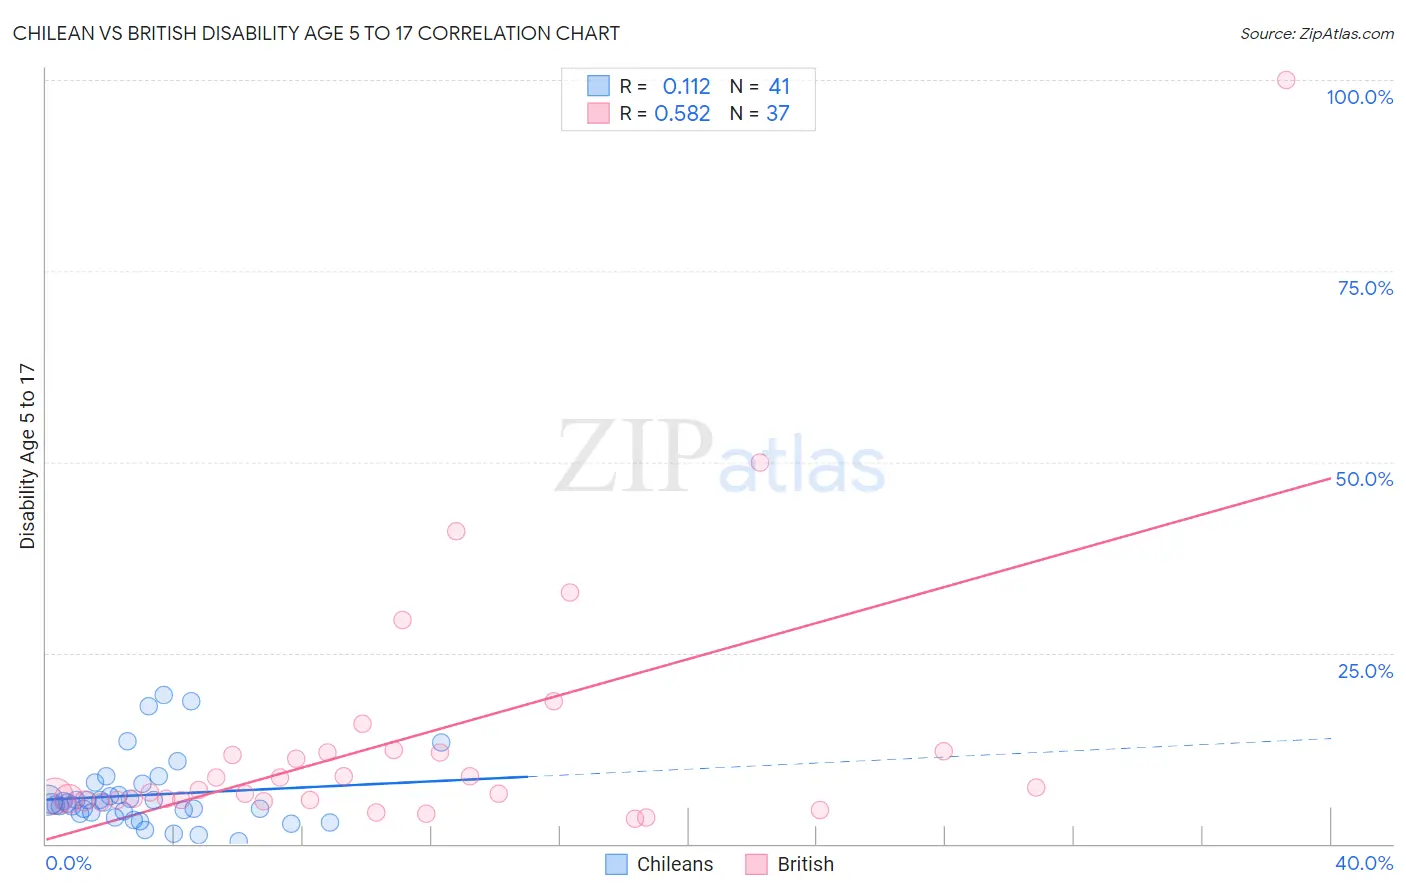
Chilean vs British Disability Age 5 to 17 Correlation Chart
The statistical analysis conducted on geographies consisting of 255,519,515 people shows a poor positive correlation between the proportion of Chileans and percentage of population with a disability between the ages 5 and 17 in the United States with a correlation coefficient (R) of 0.112 and weighted average of 5.4%. Similarly, the statistical analysis conducted on geographies consisting of 522,278,318 people shows a substantial positive correlation between the proportion of British and percentage of population with a disability between the ages 5 and 17 in the United States with a correlation coefficient (R) of 0.582 and weighted average of 5.9%, a difference of 9.2%.
Disability Age 5 to 17 Correlation Summary
| Measurement | Chilean | British |
| Minimum | 0.37% | 3.2% |
| Maximum | 19.4% | 100.0% |
| Range | 19.1% | 96.8% |
| Mean | 6.4% | 13.6% |
| Median | 5.3% | 7.0% |
| Interquartile 25% (IQ1) | 4.0% | 5.7% |
| Interquartile 75% (IQ3) | 7.2% | 12.0% |
| Interquartile Range (IQR) | 3.2% | 6.2% |
| Standard Deviation (Sample) | 4.5% | 18.0% |
| Standard Deviation (Population) | 4.4% | 17.7% |
Similar Demographics by Disability Age 5 to 17
Demographics Similar to Chileans by Disability Age 5 to 17
In terms of disability age 5 to 17, the demographic groups most similar to Chileans are Maltese (5.4%, a difference of 0.060%), Immigrants from Ethiopia (5.4%, a difference of 0.10%), Crow (5.4%, a difference of 0.23%), Immigrants from Chile (5.4%, a difference of 0.24%), and New Zealander (5.4%, a difference of 0.25%).
| Demographics | Rating | Rank | Disability Age 5 to 17 |
| Cubans | 97.8 /100 | #115 | Exceptional 5.3% |
| Cypriots | 97.7 /100 | #116 | Exceptional 5.3% |
| Immigrants | Afghanistan | 97.4 /100 | #117 | Exceptional 5.3% |
| South Americans | 97.1 /100 | #118 | Exceptional 5.4% |
| Immigrants | South America | 97.1 /100 | #119 | Exceptional 5.4% |
| Immigrants | Immigrants | 97.0 /100 | #120 | Exceptional 5.4% |
| Maltese | 96.0 /100 | #121 | Exceptional 5.4% |
| Chileans | 95.8 /100 | #122 | Exceptional 5.4% |
| Immigrants | Ethiopia | 95.5 /100 | #123 | Exceptional 5.4% |
| Crow | 95.0 /100 | #124 | Exceptional 5.4% |
| Immigrants | Chile | 95.0 /100 | #125 | Exceptional 5.4% |
| New Zealanders | 95.0 /100 | #126 | Exceptional 5.4% |
| Latvians | 95.0 /100 | #127 | Exceptional 5.4% |
| Immigrants | Venezuela | 94.5 /100 | #128 | Exceptional 5.4% |
| Romanians | 94.1 /100 | #129 | Exceptional 5.4% |
Demographics Similar to British by Disability Age 5 to 17
In terms of disability age 5 to 17, the demographic groups most similar to British are Immigrants from Ghana (5.9%, a difference of 0.010%), Immigrants from Honduras (5.9%, a difference of 0.070%), Immigrants from Micronesia (5.9%, a difference of 0.10%), Tlingit-Haida (5.9%, a difference of 0.10%), and Immigrants from Germany (5.9%, a difference of 0.11%).
| Demographics | Rating | Rank | Disability Age 5 to 17 |
| Immigrants | Caribbean | 2.1 /100 | #241 | Tragic 5.9% |
| Spaniards | 2.0 /100 | #242 | Tragic 5.9% |
| Indonesians | 2.0 /100 | #243 | Tragic 5.9% |
| Immigrants | Germany | 1.9 /100 | #244 | Tragic 5.9% |
| Immigrants | Micronesia | 1.9 /100 | #245 | Tragic 5.9% |
| Tlingit-Haida | 1.9 /100 | #246 | Tragic 5.9% |
| Immigrants | Honduras | 1.8 /100 | #247 | Tragic 5.9% |
| British | 1.7 /100 | #248 | Tragic 5.9% |
| Immigrants | Ghana | 1.7 /100 | #249 | Tragic 5.9% |
| Poles | 1.5 /100 | #250 | Tragic 5.9% |
| Immigrants | Cambodia | 1.5 /100 | #251 | Tragic 5.9% |
| Hondurans | 1.5 /100 | #252 | Tragic 5.9% |
| Scandinavians | 1.4 /100 | #253 | Tragic 5.9% |
| Barbadians | 1.3 /100 | #254 | Tragic 5.9% |
| Italians | 1.2 /100 | #255 | Tragic 5.9% |