Seminole vs Guatemalan Vision Disability
COMPARE
Seminole
Guatemalan
Vision Disability
Vision Disability Comparison
Seminole
Guatemalans
3.1%
VISION DISABILITY
0.0/ 100
METRIC RATING
332nd/ 347
METRIC RANK
2.3%
VISION DISABILITY
0.5/ 100
METRIC RATING
247th/ 347
METRIC RANK
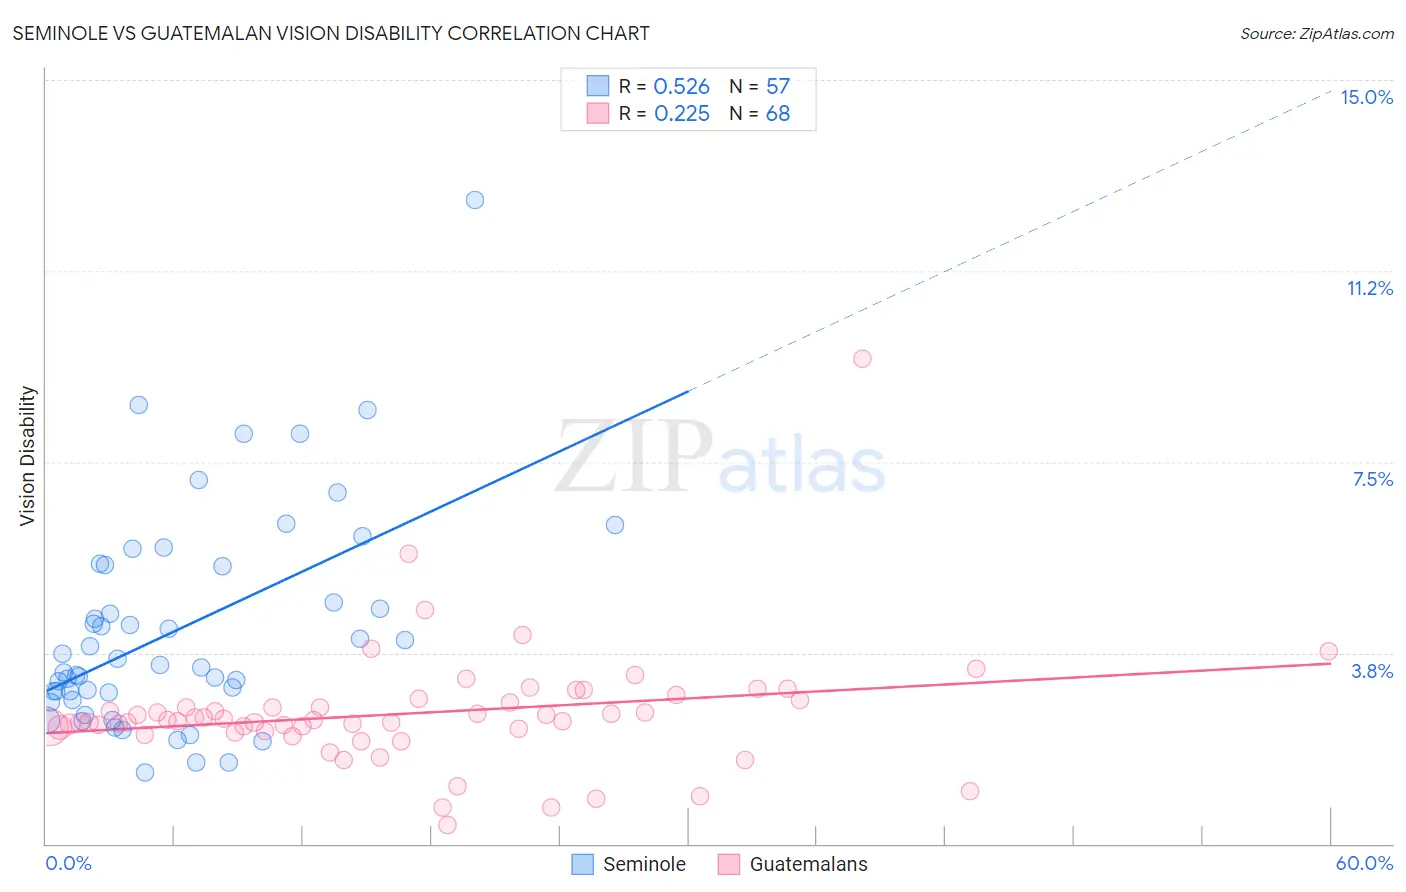
Seminole vs Guatemalan Vision Disability Correlation Chart
The statistical analysis conducted on geographies consisting of 118,301,889 people shows a substantial positive correlation between the proportion of Seminole and percentage of population with vision disability in the United States with a correlation coefficient (R) of 0.526 and weighted average of 3.1%. Similarly, the statistical analysis conducted on geographies consisting of 409,275,877 people shows a weak positive correlation between the proportion of Guatemalans and percentage of population with vision disability in the United States with a correlation coefficient (R) of 0.225 and weighted average of 2.3%, a difference of 30.3%.
Vision Disability Correlation Summary
| Measurement | Seminole | Guatemalan |
| Minimum | 1.4% | 0.37% |
| Maximum | 12.6% | 9.5% |
| Range | 11.2% | 9.2% |
| Mean | 4.2% | 2.6% |
| Median | 3.5% | 2.4% |
| Interquartile 25% (IQ1) | 2.9% | 2.2% |
| Interquartile 75% (IQ3) | 5.5% | 2.8% |
| Interquartile Range (IQR) | 2.6% | 0.57% |
| Standard Deviation (Sample) | 2.1% | 1.2% |
| Standard Deviation (Population) | 2.1% | 1.2% |
Similar Demographics by Vision Disability
Demographics Similar to Seminole by Vision Disability
In terms of vision disability, the demographic groups most similar to Seminole are Cajun (3.1%, a difference of 0.010%), Central American Indian (3.0%, a difference of 0.43%), Colville (3.0%, a difference of 1.1%), Cheyenne (3.1%, a difference of 1.1%), and Apache (3.0%, a difference of 2.3%).
| Demographics | Rating | Rank | Vision Disability |
| Cherokee | 0.0 /100 | #325 | Tragic 2.9% |
| Spanish Americans | 0.0 /100 | #326 | Tragic 2.9% |
| Natives/Alaskans | 0.0 /100 | #327 | Tragic 3.0% |
| Yuman | 0.0 /100 | #328 | Tragic 3.0% |
| Apache | 0.0 /100 | #329 | Tragic 3.0% |
| Colville | 0.0 /100 | #330 | Tragic 3.0% |
| Central American Indians | 0.0 /100 | #331 | Tragic 3.0% |
| Seminole | 0.0 /100 | #332 | Tragic 3.1% |
| Cajuns | 0.0 /100 | #333 | Tragic 3.1% |
| Cheyenne | 0.0 /100 | #334 | Tragic 3.1% |
| Navajo | 0.0 /100 | #335 | Tragic 3.1% |
| Alaskan Athabascans | 0.0 /100 | #336 | Tragic 3.1% |
| Dutch West Indians | 0.0 /100 | #337 | Tragic 3.2% |
| Chickasaw | 0.0 /100 | #338 | Tragic 3.2% |
| Tsimshian | 0.0 /100 | #339 | Tragic 3.2% |
Demographics Similar to Guatemalans by Vision Disability
In terms of vision disability, the demographic groups most similar to Guatemalans are Subsaharan African (2.3%, a difference of 0.020%), Liberian (2.3%, a difference of 0.030%), French (2.3%, a difference of 0.040%), Bangladeshi (2.3%, a difference of 0.12%), and Alsatian (2.3%, a difference of 0.19%).
| Demographics | Rating | Rank | Vision Disability |
| Panamanians | 0.9 /100 | #240 | Tragic 2.3% |
| Malaysians | 0.9 /100 | #241 | Tragic 2.3% |
| Immigrants | Panama | 0.8 /100 | #242 | Tragic 2.3% |
| Immigrants | Nicaragua | 0.6 /100 | #243 | Tragic 2.3% |
| Immigrants | West Indies | 0.6 /100 | #244 | Tragic 2.3% |
| Alsatians | 0.6 /100 | #245 | Tragic 2.3% |
| French | 0.5 /100 | #246 | Tragic 2.3% |
| Guatemalans | 0.5 /100 | #247 | Tragic 2.3% |
| Sub-Saharan Africans | 0.5 /100 | #248 | Tragic 2.3% |
| Liberians | 0.5 /100 | #249 | Tragic 2.3% |
| Bangladeshis | 0.5 /100 | #250 | Tragic 2.3% |
| Immigrants | Laos | 0.4 /100 | #251 | Tragic 2.4% |
| Immigrants | Micronesia | 0.3 /100 | #252 | Tragic 2.4% |
| Japanese | 0.3 /100 | #253 | Tragic 2.4% |
| Haitians | 0.3 /100 | #254 | Tragic 2.4% |