Immigrants from Singapore vs Guatemalan Vision Disability
COMPARE
Immigrants from Singapore
Guatemalan
Vision Disability
Vision Disability Comparison
Immigrants from Singapore
Guatemalans
1.8%
VISION DISABILITY
100.0/ 100
METRIC RATING
9th/ 347
METRIC RANK
2.3%
VISION DISABILITY
0.5/ 100
METRIC RATING
247th/ 347
METRIC RANK
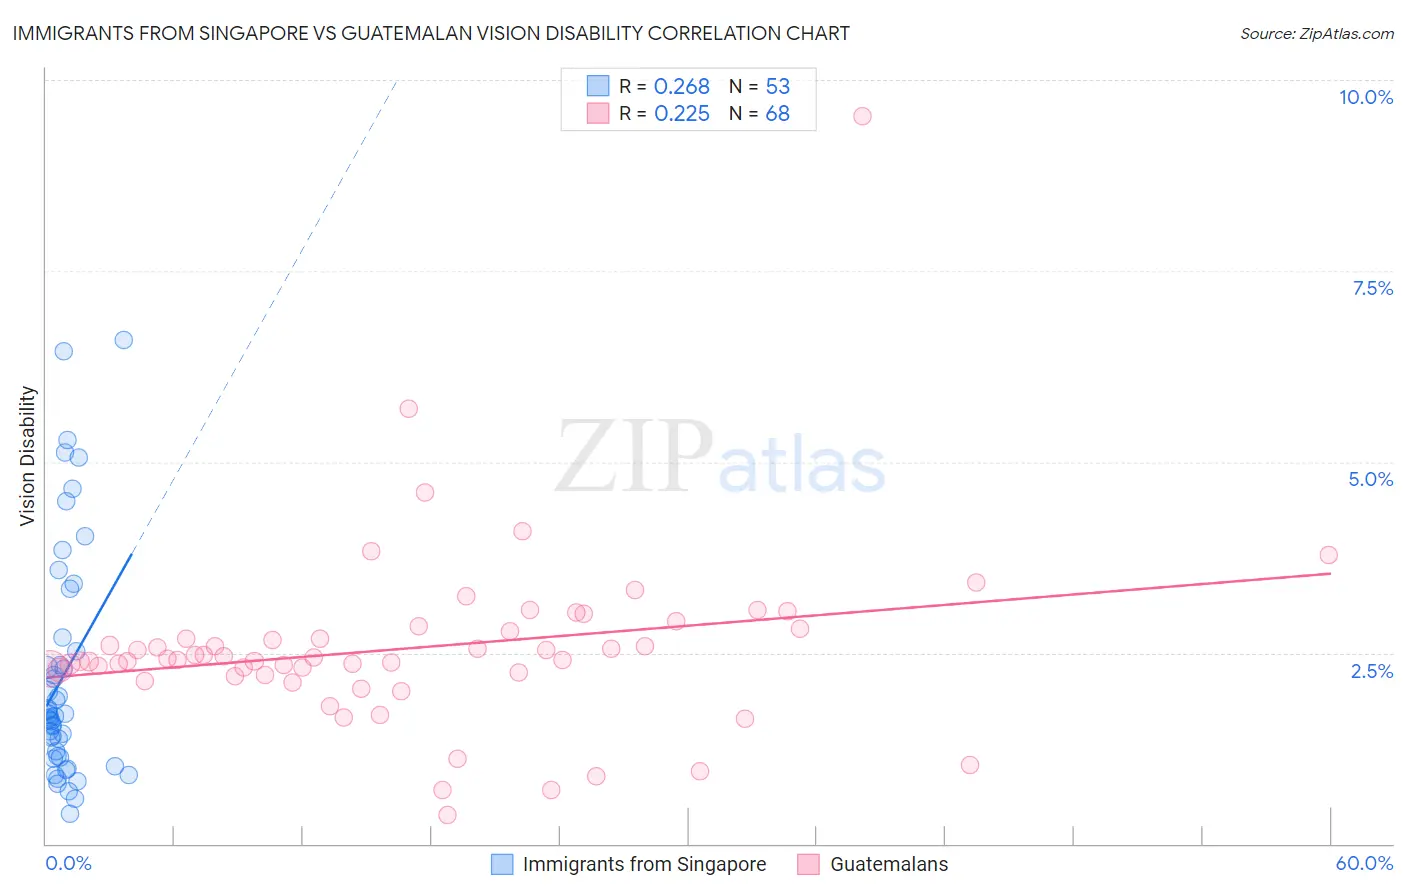
Immigrants from Singapore vs Guatemalan Vision Disability Correlation Chart
The statistical analysis conducted on geographies consisting of 137,473,730 people shows a weak positive correlation between the proportion of Immigrants from Singapore and percentage of population with vision disability in the United States with a correlation coefficient (R) of 0.268 and weighted average of 1.8%. Similarly, the statistical analysis conducted on geographies consisting of 409,275,877 people shows a weak positive correlation between the proportion of Guatemalans and percentage of population with vision disability in the United States with a correlation coefficient (R) of 0.225 and weighted average of 2.3%, a difference of 30.3%.
Vision Disability Correlation Summary
| Measurement | Immigrants from Singapore | Guatemalan |
| Minimum | 0.40% | 0.37% |
| Maximum | 6.6% | 9.5% |
| Range | 6.2% | 9.2% |
| Mean | 2.2% | 2.6% |
| Median | 1.7% | 2.4% |
| Interquartile 25% (IQ1) | 1.1% | 2.2% |
| Interquartile 75% (IQ3) | 2.6% | 2.8% |
| Interquartile Range (IQR) | 1.5% | 0.57% |
| Standard Deviation (Sample) | 1.5% | 1.2% |
| Standard Deviation (Population) | 1.5% | 1.2% |
Similar Demographics by Vision Disability
Demographics Similar to Immigrants from Singapore by Vision Disability
In terms of vision disability, the demographic groups most similar to Immigrants from Singapore are Immigrants from Hong Kong (1.8%, a difference of 0.19%), Iranian (1.8%, a difference of 0.74%), Immigrants from South Central Asia (1.8%, a difference of 0.89%), Immigrants from Iran (1.8%, a difference of 0.95%), and Immigrants from Israel (1.8%, a difference of 1.3%).
| Demographics | Rating | Rank | Vision Disability |
| Filipinos | 100.0 /100 | #2 | Exceptional 1.7% |
| Immigrants | Taiwan | 100.0 /100 | #3 | Exceptional 1.7% |
| Thais | 100.0 /100 | #4 | Exceptional 1.7% |
| Okinawans | 100.0 /100 | #5 | Exceptional 1.8% |
| Immigrants | Iran | 100.0 /100 | #6 | Exceptional 1.8% |
| Immigrants | South Central Asia | 100.0 /100 | #7 | Exceptional 1.8% |
| Iranians | 100.0 /100 | #8 | Exceptional 1.8% |
| Immigrants | Singapore | 100.0 /100 | #9 | Exceptional 1.8% |
| Immigrants | Hong Kong | 100.0 /100 | #10 | Exceptional 1.8% |
| Immigrants | Israel | 100.0 /100 | #11 | Exceptional 1.8% |
| Immigrants | Korea | 100.0 /100 | #12 | Exceptional 1.8% |
| Immigrants | Eastern Asia | 100.0 /100 | #13 | Exceptional 1.8% |
| Immigrants | China | 100.0 /100 | #14 | Exceptional 1.8% |
| Immigrants | Bolivia | 100.0 /100 | #15 | Exceptional 1.8% |
| Indians (Asian) | 100.0 /100 | #16 | Exceptional 1.8% |
Demographics Similar to Guatemalans by Vision Disability
In terms of vision disability, the demographic groups most similar to Guatemalans are Subsaharan African (2.3%, a difference of 0.020%), Liberian (2.3%, a difference of 0.030%), French (2.3%, a difference of 0.040%), Bangladeshi (2.3%, a difference of 0.12%), and Alsatian (2.3%, a difference of 0.19%).
| Demographics | Rating | Rank | Vision Disability |
| Panamanians | 0.9 /100 | #240 | Tragic 2.3% |
| Malaysians | 0.9 /100 | #241 | Tragic 2.3% |
| Immigrants | Panama | 0.8 /100 | #242 | Tragic 2.3% |
| Immigrants | Nicaragua | 0.6 /100 | #243 | Tragic 2.3% |
| Immigrants | West Indies | 0.6 /100 | #244 | Tragic 2.3% |
| Alsatians | 0.6 /100 | #245 | Tragic 2.3% |
| French | 0.5 /100 | #246 | Tragic 2.3% |
| Guatemalans | 0.5 /100 | #247 | Tragic 2.3% |
| Sub-Saharan Africans | 0.5 /100 | #248 | Tragic 2.3% |
| Liberians | 0.5 /100 | #249 | Tragic 2.3% |
| Bangladeshis | 0.5 /100 | #250 | Tragic 2.3% |
| Immigrants | Laos | 0.4 /100 | #251 | Tragic 2.4% |
| Immigrants | Micronesia | 0.3 /100 | #252 | Tragic 2.4% |
| Japanese | 0.3 /100 | #253 | Tragic 2.4% |
| Haitians | 0.3 /100 | #254 | Tragic 2.4% |