Osage vs Guatemalan Vision Disability
COMPARE
Osage
Guatemalan
Vision Disability
Vision Disability Comparison
Osage
Guatemalans
2.7%
VISION DISABILITY
0.0/ 100
METRIC RATING
315th/ 347
METRIC RANK
2.3%
VISION DISABILITY
0.5/ 100
METRIC RATING
247th/ 347
METRIC RANK
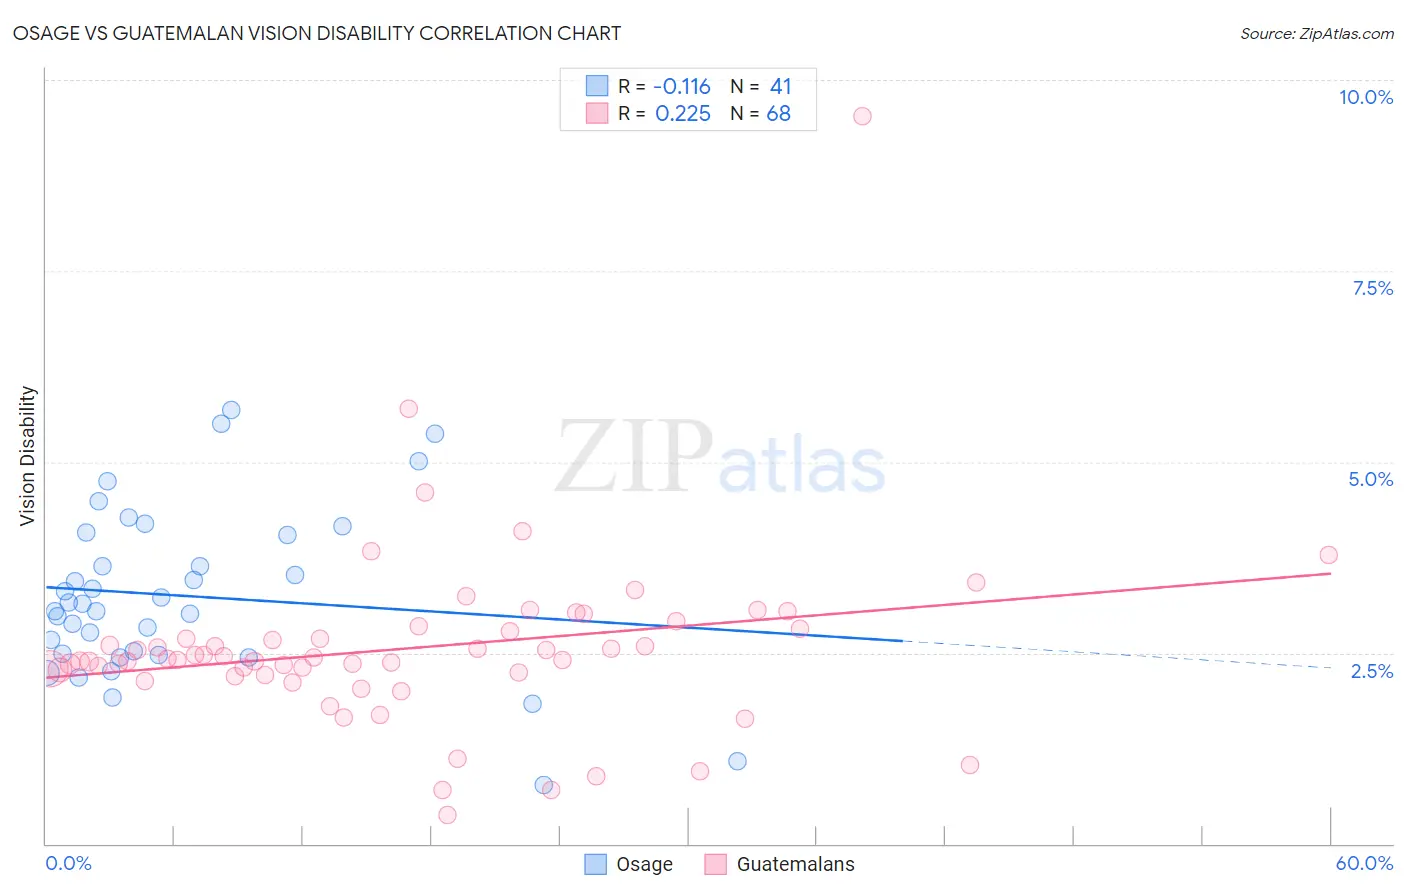
Osage vs Guatemalan Vision Disability Correlation Chart
The statistical analysis conducted on geographies consisting of 91,791,636 people shows a poor negative correlation between the proportion of Osage and percentage of population with vision disability in the United States with a correlation coefficient (R) of -0.116 and weighted average of 2.7%. Similarly, the statistical analysis conducted on geographies consisting of 409,275,877 people shows a weak positive correlation between the proportion of Guatemalans and percentage of population with vision disability in the United States with a correlation coefficient (R) of 0.225 and weighted average of 2.3%, a difference of 14.3%.
Vision Disability Correlation Summary
| Measurement | Osage | Guatemalan |
| Minimum | 0.78% | 0.37% |
| Maximum | 5.7% | 9.5% |
| Range | 4.9% | 9.2% |
| Mean | 3.2% | 2.6% |
| Median | 3.1% | 2.4% |
| Interquartile 25% (IQ1) | 2.5% | 2.2% |
| Interquartile 75% (IQ3) | 4.1% | 2.8% |
| Interquartile Range (IQR) | 1.6% | 0.57% |
| Standard Deviation (Sample) | 1.1% | 1.2% |
| Standard Deviation (Population) | 1.1% | 1.2% |
Similar Demographics by Vision Disability
Demographics Similar to Osage by Vision Disability
In terms of vision disability, the demographic groups most similar to Osage are Shoshone (2.7%, a difference of 0.43%), Yup'ik (2.7%, a difference of 0.63%), Inupiat (2.7%, a difference of 1.2%), Potawatomi (2.6%, a difference of 1.3%), and American (2.6%, a difference of 1.3%).
| Demographics | Rating | Rank | Vision Disability |
| Arapaho | 0.0 /100 | #308 | Tragic 2.6% |
| Immigrants | Yemen | 0.0 /100 | #309 | Tragic 2.6% |
| Blackfeet | 0.0 /100 | #310 | Tragic 2.6% |
| Dominicans | 0.0 /100 | #311 | Tragic 2.6% |
| Americans | 0.0 /100 | #312 | Tragic 2.6% |
| Potawatomi | 0.0 /100 | #313 | Tragic 2.6% |
| Inupiat | 0.0 /100 | #314 | Tragic 2.7% |
| Osage | 0.0 /100 | #315 | Tragic 2.7% |
| Shoshone | 0.0 /100 | #316 | Tragic 2.7% |
| Yup'ik | 0.0 /100 | #317 | Tragic 2.7% |
| Alaska Natives | 0.0 /100 | #318 | Tragic 2.7% |
| Tohono O'odham | 0.0 /100 | #319 | Tragic 2.8% |
| Blacks/African Americans | 0.0 /100 | #320 | Tragic 2.8% |
| Comanche | 0.0 /100 | #321 | Tragic 2.8% |
| Paiute | 0.0 /100 | #322 | Tragic 2.9% |
Demographics Similar to Guatemalans by Vision Disability
In terms of vision disability, the demographic groups most similar to Guatemalans are Subsaharan African (2.3%, a difference of 0.020%), Liberian (2.3%, a difference of 0.030%), French (2.3%, a difference of 0.040%), Bangladeshi (2.3%, a difference of 0.12%), and Alsatian (2.3%, a difference of 0.19%).
| Demographics | Rating | Rank | Vision Disability |
| Panamanians | 0.9 /100 | #240 | Tragic 2.3% |
| Malaysians | 0.9 /100 | #241 | Tragic 2.3% |
| Immigrants | Panama | 0.8 /100 | #242 | Tragic 2.3% |
| Immigrants | Nicaragua | 0.6 /100 | #243 | Tragic 2.3% |
| Immigrants | West Indies | 0.6 /100 | #244 | Tragic 2.3% |
| Alsatians | 0.6 /100 | #245 | Tragic 2.3% |
| French | 0.5 /100 | #246 | Tragic 2.3% |
| Guatemalans | 0.5 /100 | #247 | Tragic 2.3% |
| Sub-Saharan Africans | 0.5 /100 | #248 | Tragic 2.3% |
| Liberians | 0.5 /100 | #249 | Tragic 2.3% |
| Bangladeshis | 0.5 /100 | #250 | Tragic 2.3% |
| Immigrants | Laos | 0.4 /100 | #251 | Tragic 2.4% |
| Immigrants | Micronesia | 0.3 /100 | #252 | Tragic 2.4% |
| Japanese | 0.3 /100 | #253 | Tragic 2.4% |
| Haitians | 0.3 /100 | #254 | Tragic 2.4% |