Kenyan vs Guatemalan Vision Disability
COMPARE
Kenyan
Guatemalan
Vision Disability
Vision Disability Comparison
Kenyans
Guatemalans
2.1%
VISION DISABILITY
92.5/ 100
METRIC RATING
113th/ 347
METRIC RANK
2.3%
VISION DISABILITY
0.5/ 100
METRIC RATING
247th/ 347
METRIC RANK
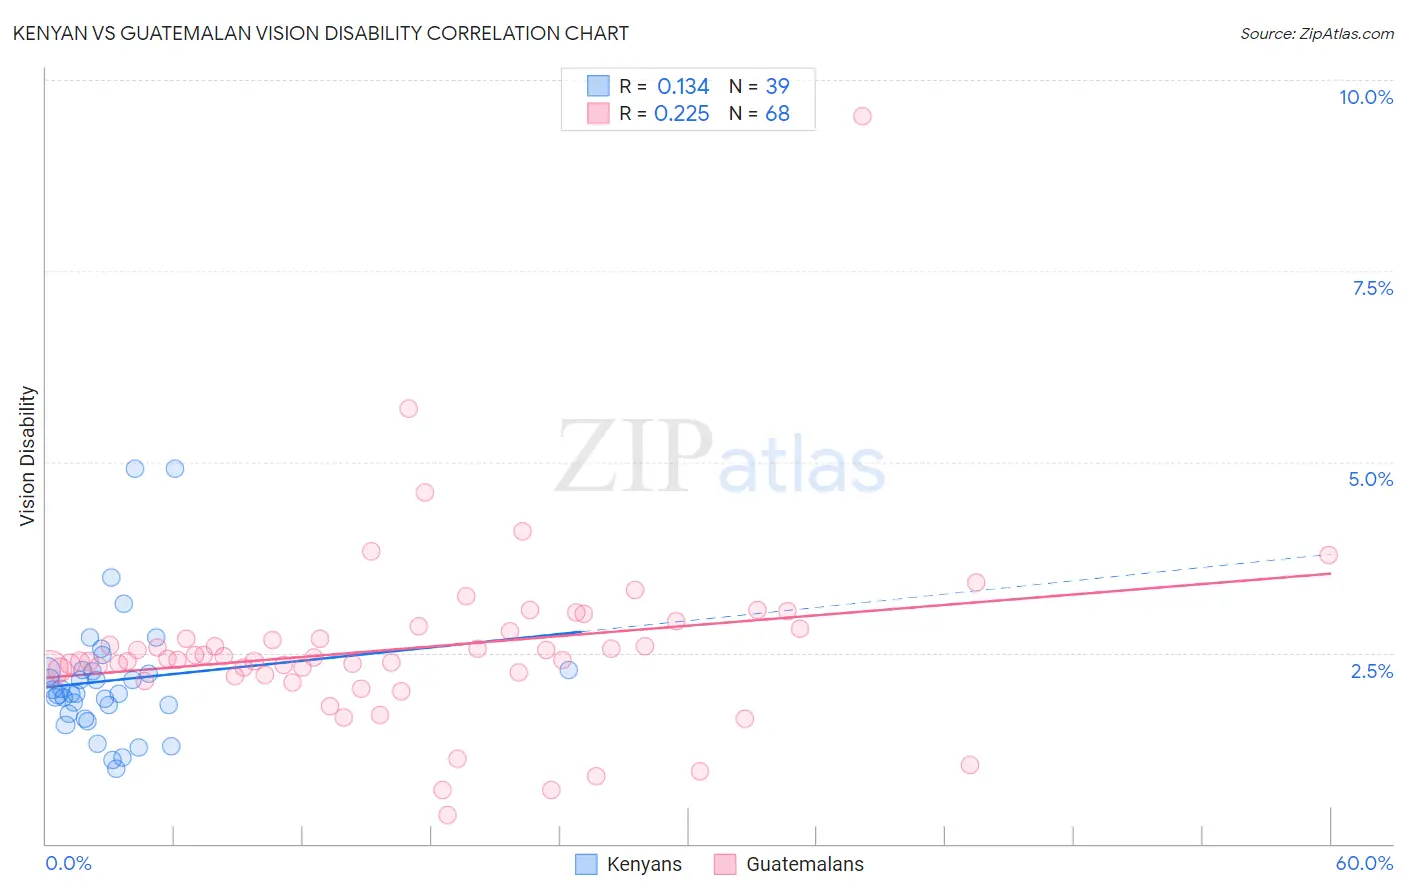
Kenyan vs Guatemalan Vision Disability Correlation Chart
The statistical analysis conducted on geographies consisting of 168,152,432 people shows a poor positive correlation between the proportion of Kenyans and percentage of population with vision disability in the United States with a correlation coefficient (R) of 0.134 and weighted average of 2.1%. Similarly, the statistical analysis conducted on geographies consisting of 409,275,877 people shows a weak positive correlation between the proportion of Guatemalans and percentage of population with vision disability in the United States with a correlation coefficient (R) of 0.225 and weighted average of 2.3%, a difference of 12.8%.
Vision Disability Correlation Summary
| Measurement | Kenyan | Guatemalan |
| Minimum | 0.99% | 0.37% |
| Maximum | 4.9% | 9.5% |
| Range | 3.9% | 9.2% |
| Mean | 2.1% | 2.6% |
| Median | 2.0% | 2.4% |
| Interquartile 25% (IQ1) | 1.7% | 2.2% |
| Interquartile 75% (IQ3) | 2.3% | 2.8% |
| Interquartile Range (IQR) | 0.58% | 0.57% |
| Standard Deviation (Sample) | 0.84% | 1.2% |
| Standard Deviation (Population) | 0.83% | 1.2% |
Similar Demographics by Vision Disability
Demographics Similar to Kenyans by Vision Disability
In terms of vision disability, the demographic groups most similar to Kenyans are Croatian (2.1%, a difference of 0.030%), Immigrants from Vietnam (2.1%, a difference of 0.060%), Ugandan (2.1%, a difference of 0.060%), Polish (2.1%, a difference of 0.11%), and Immigrants from Denmark (2.1%, a difference of 0.12%).
| Demographics | Rating | Rank | Vision Disability |
| Swedes | 94.2 /100 | #106 | Exceptional 2.1% |
| Danes | 94.2 /100 | #107 | Exceptional 2.1% |
| Koreans | 94.1 /100 | #108 | Exceptional 2.1% |
| Chileans | 94.0 /100 | #109 | Exceptional 2.1% |
| Immigrants | Armenia | 93.8 /100 | #110 | Exceptional 2.1% |
| Peruvians | 93.5 /100 | #111 | Exceptional 2.1% |
| Immigrants | Denmark | 92.9 /100 | #112 | Exceptional 2.1% |
| Kenyans | 92.5 /100 | #113 | Exceptional 2.1% |
| Croatians | 92.3 /100 | #114 | Exceptional 2.1% |
| Immigrants | Vietnam | 92.2 /100 | #115 | Exceptional 2.1% |
| Ugandans | 92.2 /100 | #116 | Exceptional 2.1% |
| Poles | 92.0 /100 | #117 | Exceptional 2.1% |
| Immigrants | Philippines | 91.4 /100 | #118 | Exceptional 2.1% |
| Immigrants | Uganda | 91.4 /100 | #119 | Exceptional 2.1% |
| Immigrants | Zimbabwe | 91.0 /100 | #120 | Exceptional 2.1% |
Demographics Similar to Guatemalans by Vision Disability
In terms of vision disability, the demographic groups most similar to Guatemalans are Subsaharan African (2.3%, a difference of 0.020%), Liberian (2.3%, a difference of 0.030%), French (2.3%, a difference of 0.040%), Bangladeshi (2.3%, a difference of 0.12%), and Alsatian (2.3%, a difference of 0.19%).
| Demographics | Rating | Rank | Vision Disability |
| Panamanians | 0.9 /100 | #240 | Tragic 2.3% |
| Malaysians | 0.9 /100 | #241 | Tragic 2.3% |
| Immigrants | Panama | 0.8 /100 | #242 | Tragic 2.3% |
| Immigrants | Nicaragua | 0.6 /100 | #243 | Tragic 2.3% |
| Immigrants | West Indies | 0.6 /100 | #244 | Tragic 2.3% |
| Alsatians | 0.6 /100 | #245 | Tragic 2.3% |
| French | 0.5 /100 | #246 | Tragic 2.3% |
| Guatemalans | 0.5 /100 | #247 | Tragic 2.3% |
| Sub-Saharan Africans | 0.5 /100 | #248 | Tragic 2.3% |
| Liberians | 0.5 /100 | #249 | Tragic 2.3% |
| Bangladeshis | 0.5 /100 | #250 | Tragic 2.3% |
| Immigrants | Laos | 0.4 /100 | #251 | Tragic 2.4% |
| Immigrants | Micronesia | 0.3 /100 | #252 | Tragic 2.4% |
| Japanese | 0.3 /100 | #253 | Tragic 2.4% |
| Haitians | 0.3 /100 | #254 | Tragic 2.4% |