Immigrants from Bulgaria vs Ugandan Disability Age 5 to 17
COMPARE
Immigrants from Bulgaria
Ugandan
Disability Age 5 to 17
Disability Age 5 to 17 Comparison
Immigrants from Bulgaria
Ugandans
5.4%
DISABILITY AGE 5 TO 17
94.0/ 100
METRIC RATING
130th/ 347
METRIC RANK
6.2%
DISABILITY AGE 5 TO 17
0.0/ 100
METRIC RATING
283rd/ 347
METRIC RANK
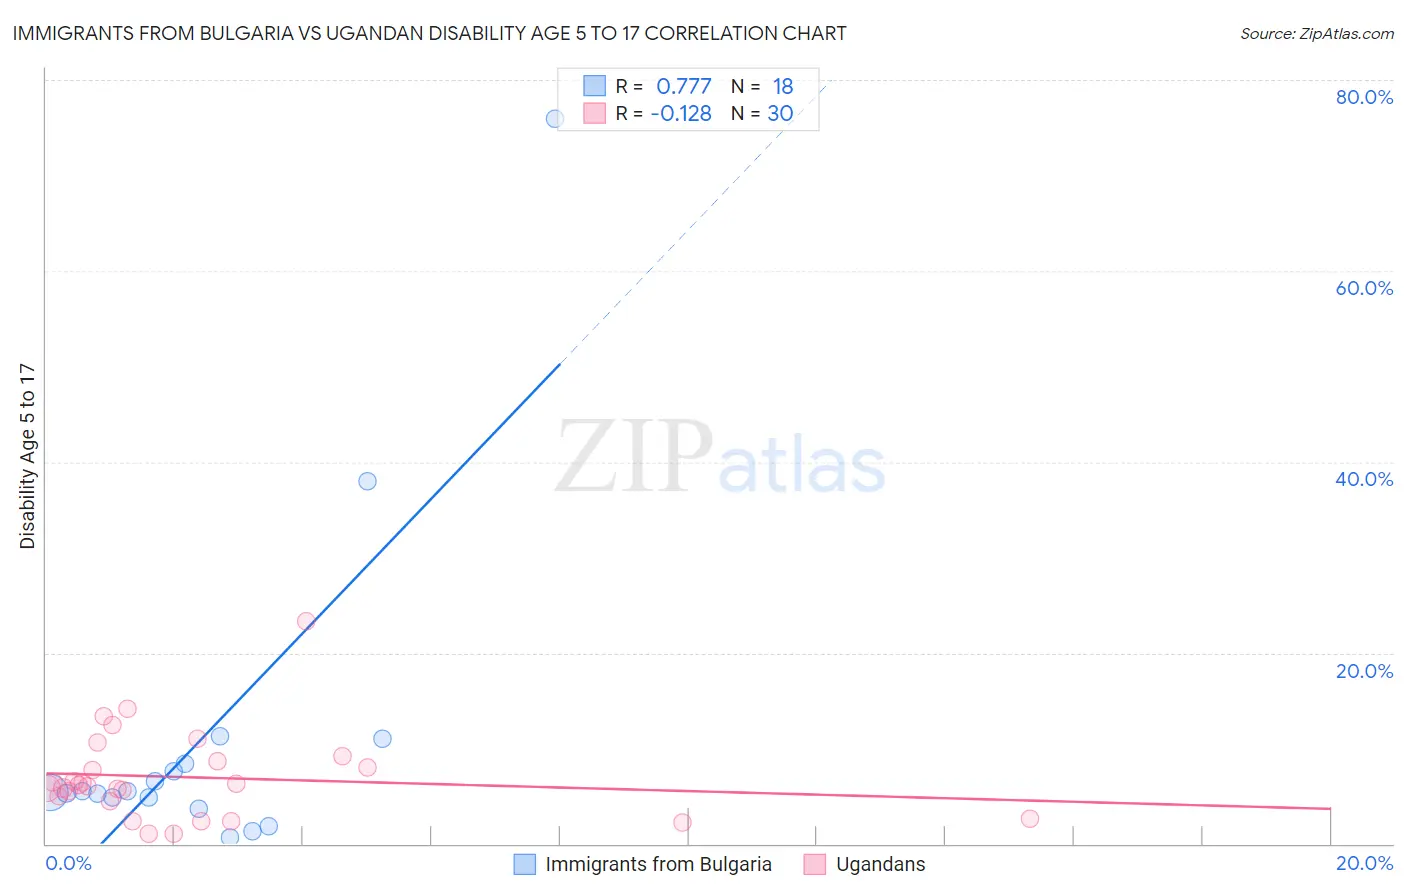
Immigrants from Bulgaria vs Ugandan Disability Age 5 to 17 Correlation Chart
The statistical analysis conducted on geographies consisting of 171,828,354 people shows a strong positive correlation between the proportion of Immigrants from Bulgaria and percentage of population with a disability between the ages 5 and 17 in the United States with a correlation coefficient (R) of 0.777 and weighted average of 5.4%. Similarly, the statistical analysis conducted on geographies consisting of 93,800,816 people shows a poor negative correlation between the proportion of Ugandans and percentage of population with a disability between the ages 5 and 17 in the United States with a correlation coefficient (R) of -0.128 and weighted average of 6.2%, a difference of 13.8%.
Disability Age 5 to 17 Correlation Summary
| Measurement | Immigrants from Bulgaria | Ugandan |
| Minimum | 0.67% | 1.1% |
| Maximum | 76.0% | 23.3% |
| Range | 75.3% | 22.2% |
| Mean | 11.3% | 7.0% |
| Median | 5.4% | 6.1% |
| Interquartile 25% (IQ1) | 4.8% | 4.5% |
| Interquartile 75% (IQ3) | 8.4% | 8.7% |
| Interquartile Range (IQR) | 3.6% | 4.2% |
| Standard Deviation (Sample) | 18.1% | 4.6% |
| Standard Deviation (Population) | 17.6% | 4.6% |
Similar Demographics by Disability Age 5 to 17
Demographics Similar to Immigrants from Bulgaria by Disability Age 5 to 17
In terms of disability age 5 to 17, the demographic groups most similar to Immigrants from Bulgaria are Romanian (5.4%, a difference of 0.020%), Immigrants from Venezuela (5.4%, a difference of 0.11%), New Zealander (5.4%, a difference of 0.23%), Latvian (5.4%, a difference of 0.23%), and Arab (5.4%, a difference of 0.23%).
| Demographics | Rating | Rank | Disability Age 5 to 17 |
| Immigrants | Ethiopia | 95.5 /100 | #123 | Exceptional 5.4% |
| Crow | 95.0 /100 | #124 | Exceptional 5.4% |
| Immigrants | Chile | 95.0 /100 | #125 | Exceptional 5.4% |
| New Zealanders | 95.0 /100 | #126 | Exceptional 5.4% |
| Latvians | 95.0 /100 | #127 | Exceptional 5.4% |
| Immigrants | Venezuela | 94.5 /100 | #128 | Exceptional 5.4% |
| Romanians | 94.1 /100 | #129 | Exceptional 5.4% |
| Immigrants | Bulgaria | 94.0 /100 | #130 | Exceptional 5.4% |
| Arabs | 92.9 /100 | #131 | Exceptional 5.4% |
| Immigrants | Colombia | 92.9 /100 | #132 | Exceptional 5.4% |
| Venezuelans | 92.7 /100 | #133 | Exceptional 5.4% |
| Yuman | 92.3 /100 | #134 | Exceptional 5.4% |
| Immigrants | Belize | 91.7 /100 | #135 | Exceptional 5.4% |
| Immigrants | Denmark | 91.4 /100 | #136 | Exceptional 5.4% |
| Navajo | 90.9 /100 | #137 | Exceptional 5.4% |
Demographics Similar to Ugandans by Disability Age 5 to 17
In terms of disability age 5 to 17, the demographic groups most similar to Ugandans are Subsaharan African (6.2%, a difference of 0.030%), English (6.2%, a difference of 0.030%), Colville (6.2%, a difference of 0.070%), German (6.1%, a difference of 0.16%), and Pima (6.2%, a difference of 0.26%).
| Demographics | Rating | Rank | Disability Age 5 to 17 |
| Japanese | 0.1 /100 | #276 | Tragic 6.1% |
| Puget Sound Salish | 0.1 /100 | #277 | Tragic 6.1% |
| Immigrants | Liberia | 0.1 /100 | #278 | Tragic 6.1% |
| Immigrants | Jamaica | 0.1 /100 | #279 | Tragic 6.1% |
| Portuguese | 0.1 /100 | #280 | Tragic 6.1% |
| Scottish | 0.0 /100 | #281 | Tragic 6.1% |
| Germans | 0.0 /100 | #282 | Tragic 6.1% |
| Ugandans | 0.0 /100 | #283 | Tragic 6.2% |
| Sub-Saharan Africans | 0.0 /100 | #284 | Tragic 6.2% |
| English | 0.0 /100 | #285 | Tragic 6.2% |
| Colville | 0.0 /100 | #286 | Tragic 6.2% |
| Pima | 0.0 /100 | #287 | Tragic 6.2% |
| Jamaicans | 0.0 /100 | #288 | Tragic 6.2% |
| Yaqui | 0.0 /100 | #289 | Tragic 6.2% |
| Immigrants | Congo | 0.0 /100 | #290 | Tragic 6.2% |