Honduran vs Ugandan 10th Grade
COMPARE
Honduran
Ugandan
10th Grade
10th Grade Comparison
Hondurans
Ugandans
89.0%
10TH GRADE
0.0/ 100
METRIC RATING
333rd/ 347
METRIC RANK
94.0%
10TH GRADE
80.7/ 100
METRIC RATING
149th/ 347
METRIC RANK
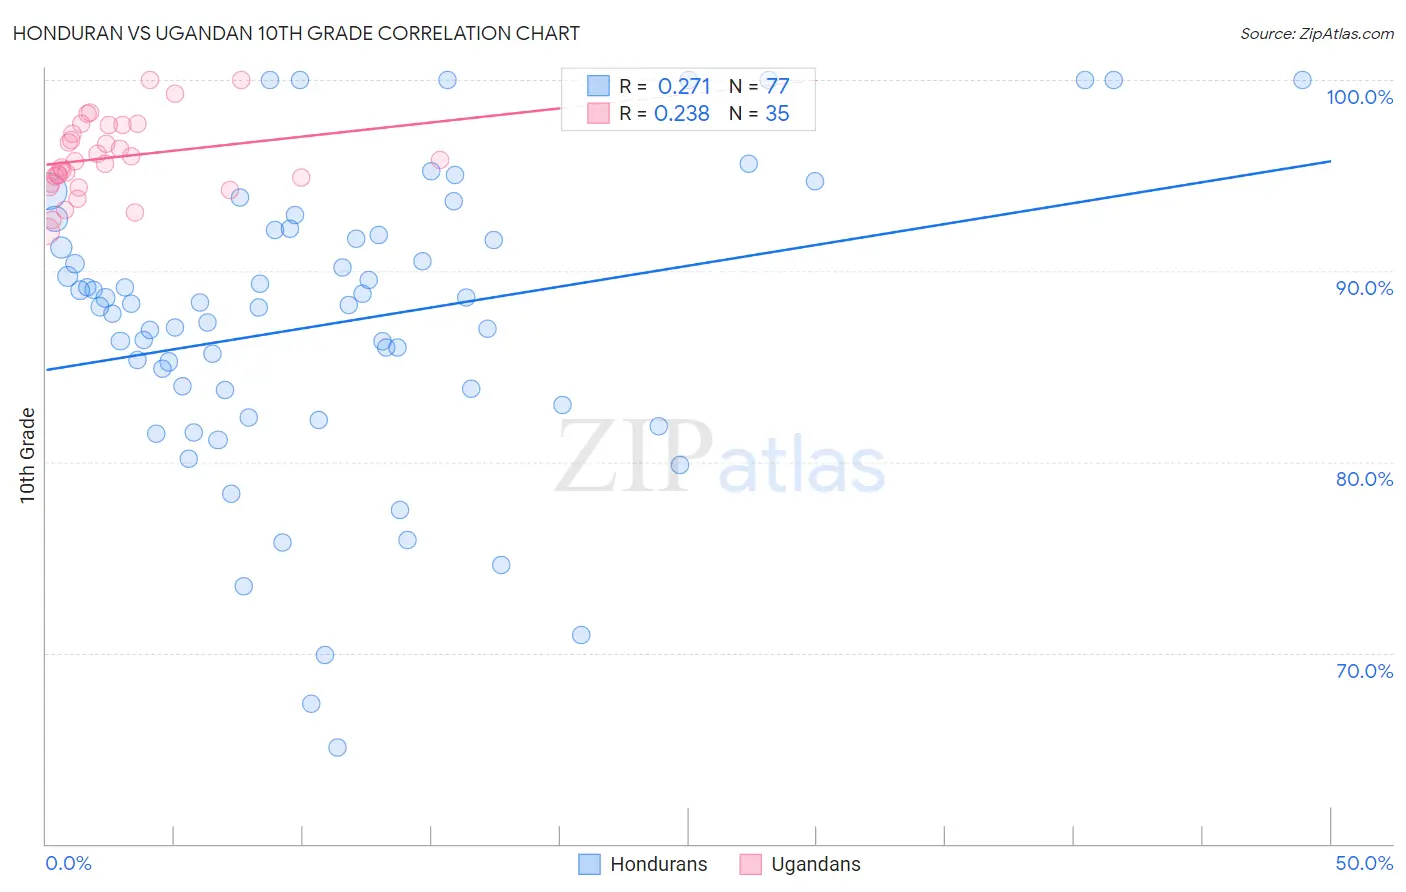
Honduran vs Ugandan 10th Grade Correlation Chart
The statistical analysis conducted on geographies consisting of 357,858,827 people shows a weak positive correlation between the proportion of Hondurans and percentage of population with at least 10th grade education in the United States with a correlation coefficient (R) of 0.271 and weighted average of 89.0%. Similarly, the statistical analysis conducted on geographies consisting of 93,990,882 people shows a weak positive correlation between the proportion of Ugandans and percentage of population with at least 10th grade education in the United States with a correlation coefficient (R) of 0.238 and weighted average of 94.0%, a difference of 5.7%.
10th Grade Correlation Summary
| Measurement | Honduran | Ugandan |
| Minimum | 65.0% | 92.1% |
| Maximum | 100.0% | 100.0% |
| Range | 35.0% | 7.9% |
| Mean | 87.3% | 95.9% |
| Median | 88.2% | 95.8% |
| Interquartile 25% (IQ1) | 83.4% | 94.6% |
| Interquartile 75% (IQ3) | 92.0% | 97.6% |
| Interquartile Range (IQR) | 8.6% | 3.1% |
| Standard Deviation (Sample) | 7.7% | 2.0% |
| Standard Deviation (Population) | 7.7% | 1.9% |
Similar Demographics by 10th Grade
Demographics Similar to Hondurans by 10th Grade
In terms of 10th grade, the demographic groups most similar to Hondurans are Immigrants from the Azores (89.0%, a difference of 0.030%), Mexican American Indian (89.0%, a difference of 0.070%), Immigrants from Yemen (89.1%, a difference of 0.10%), Hispanic or Latino (88.9%, a difference of 0.12%), and Immigrants from Dominican Republic (88.7%, a difference of 0.30%).
| Demographics | Rating | Rank | 10th Grade |
| Central American Indians | 0.0 /100 | #326 | Tragic 89.7% |
| Immigrants | Nicaragua | 0.0 /100 | #327 | Tragic 89.5% |
| Immigrants | Cabo Verde | 0.0 /100 | #328 | Tragic 89.5% |
| Dominicans | 0.0 /100 | #329 | Tragic 89.4% |
| Immigrants | Yemen | 0.0 /100 | #330 | Tragic 89.1% |
| Mexican American Indians | 0.0 /100 | #331 | Tragic 89.0% |
| Immigrants | Azores | 0.0 /100 | #332 | Tragic 89.0% |
| Hondurans | 0.0 /100 | #333 | Tragic 89.0% |
| Hispanics or Latinos | 0.0 /100 | #334 | Tragic 88.9% |
| Immigrants | Dominican Republic | 0.0 /100 | #335 | Tragic 88.7% |
| Immigrants | Honduras | 0.0 /100 | #336 | Tragic 88.5% |
| Central Americans | 0.0 /100 | #337 | Tragic 88.4% |
| Immigrants | Latin America | 0.0 /100 | #338 | Tragic 88.3% |
| Guatemalans | 0.0 /100 | #339 | Tragic 87.9% |
| Mexicans | 0.0 /100 | #340 | Tragic 87.8% |
Demographics Similar to Ugandans by 10th Grade
In terms of 10th grade, the demographic groups most similar to Ugandans are Arab (94.0%, a difference of 0.0%), Immigrants from Ukraine (94.0%, a difference of 0.010%), Egyptian (94.0%, a difference of 0.020%), Kenyan (94.0%, a difference of 0.020%), and Chickasaw (94.1%, a difference of 0.030%).
| Demographics | Rating | Rank | 10th Grade |
| Albanians | 86.5 /100 | #142 | Excellent 94.1% |
| Cherokee | 84.9 /100 | #143 | Excellent 94.1% |
| Immigrants | Kazakhstan | 84.9 /100 | #144 | Excellent 94.1% |
| Immigrants | Nonimmigrants | 83.8 /100 | #145 | Excellent 94.1% |
| Chickasaw | 82.6 /100 | #146 | Excellent 94.1% |
| Immigrants | Ukraine | 81.5 /100 | #147 | Excellent 94.0% |
| Arabs | 80.9 /100 | #148 | Excellent 94.0% |
| Ugandans | 80.7 /100 | #149 | Excellent 94.0% |
| Egyptians | 79.6 /100 | #150 | Good 94.0% |
| Kenyans | 79.1 /100 | #151 | Good 94.0% |
| Immigrants | Italy | 78.0 /100 | #152 | Good 94.0% |
| Immigrants | Brazil | 75.5 /100 | #153 | Good 94.0% |
| Immigrants | Kenya | 75.3 /100 | #154 | Good 94.0% |
| Spanish | 74.9 /100 | #155 | Good 94.0% |
| Mongolians | 74.4 /100 | #156 | Good 94.0% |