Guyanese vs Indian (Asian) Male Disability
COMPARE
Guyanese
Indian (Asian)
Male Disability
Male Disability Comparison
Guyanese
Indians (Asian)
10.5%
MALE DISABILITY
99.2/ 100
METRIC RATING
66th/ 347
METRIC RANK
9.7%
MALE DISABILITY
100.0/ 100
METRIC RATING
15th/ 347
METRIC RANK
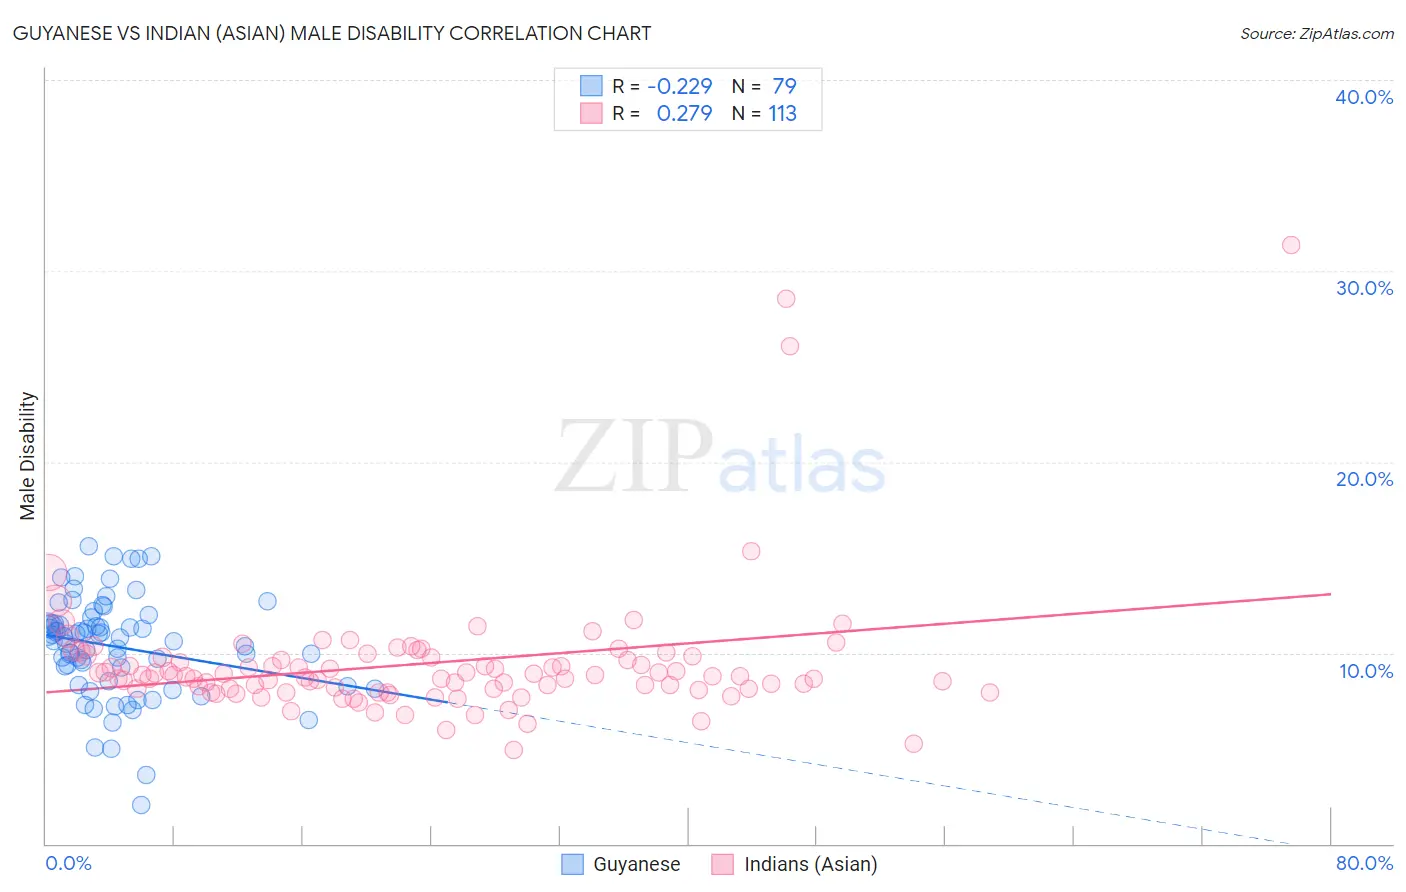
Guyanese vs Indian (Asian) Male Disability Correlation Chart
The statistical analysis conducted on geographies consisting of 176,893,996 people shows a weak negative correlation between the proportion of Guyanese and percentage of males with a disability in the United States with a correlation coefficient (R) of -0.229 and weighted average of 10.5%. Similarly, the statistical analysis conducted on geographies consisting of 495,201,745 people shows a weak positive correlation between the proportion of Indians (Asian) and percentage of males with a disability in the United States with a correlation coefficient (R) of 0.279 and weighted average of 9.7%, a difference of 7.6%.
Male Disability Correlation Summary
| Measurement | Guyanese | Indian (Asian) |
| Minimum | 2.0% | 4.9% |
| Maximum | 15.6% | 31.4% |
| Range | 13.6% | 26.5% |
| Mean | 10.3% | 9.4% |
| Median | 10.8% | 8.8% |
| Interquartile 25% (IQ1) | 8.5% | 8.1% |
| Interquartile 75% (IQ3) | 11.5% | 9.8% |
| Interquartile Range (IQR) | 3.0% | 1.7% |
| Standard Deviation (Sample) | 2.6% | 3.5% |
| Standard Deviation (Population) | 2.6% | 3.5% |
Similar Demographics by Male Disability
Demographics Similar to Guyanese by Male Disability
In terms of male disability, the demographic groups most similar to Guyanese are Immigrants from Grenada (10.5%, a difference of 0.0%), Immigrants from Afghanistan (10.5%, a difference of 0.010%), Jordanian (10.5%, a difference of 0.030%), Colombian (10.5%, a difference of 0.10%), and Ecuadorian (10.5%, a difference of 0.11%).
| Demographics | Rating | Rank | Male Disability |
| Immigrants | Australia | 99.5 /100 | #59 | Exceptional 10.4% |
| Immigrants | Colombia | 99.5 /100 | #60 | Exceptional 10.4% |
| Immigrants | Northern Africa | 99.4 /100 | #61 | Exceptional 10.4% |
| Immigrants | Ecuador | 99.3 /100 | #62 | Exceptional 10.4% |
| Immigrants | Belarus | 99.3 /100 | #63 | Exceptional 10.4% |
| Jordanians | 99.3 /100 | #64 | Exceptional 10.5% |
| Immigrants | Grenada | 99.2 /100 | #65 | Exceptional 10.5% |
| Guyanese | 99.2 /100 | #66 | Exceptional 10.5% |
| Immigrants | Afghanistan | 99.2 /100 | #67 | Exceptional 10.5% |
| Colombians | 99.2 /100 | #68 | Exceptional 10.5% |
| Ecuadorians | 99.2 /100 | #69 | Exceptional 10.5% |
| Immigrants | Bulgaria | 99.1 /100 | #70 | Exceptional 10.5% |
| Immigrants | Cameroon | 99.0 /100 | #71 | Exceptional 10.5% |
| Immigrants | Serbia | 99.0 /100 | #72 | Exceptional 10.5% |
| Immigrants | Lithuania | 98.9 /100 | #73 | Exceptional 10.5% |
Demographics Similar to Indians (Asian) by Male Disability
In terms of male disability, the demographic groups most similar to Indians (Asian) are Immigrants from Iran (9.7%, a difference of 0.45%), Iranian (9.7%, a difference of 0.55%), Okinawan (9.8%, a difference of 0.61%), Immigrants from Korea (9.8%, a difference of 0.75%), and Bolivian (9.6%, a difference of 0.78%).
| Demographics | Rating | Rank | Male Disability |
| Immigrants | China | 100.0 /100 | #8 | Exceptional 9.5% |
| Immigrants | Singapore | 100.0 /100 | #9 | Exceptional 9.5% |
| Immigrants | Israel | 100.0 /100 | #10 | Exceptional 9.6% |
| Immigrants | Eastern Asia | 100.0 /100 | #11 | Exceptional 9.6% |
| Bolivians | 100.0 /100 | #12 | Exceptional 9.6% |
| Iranians | 100.0 /100 | #13 | Exceptional 9.7% |
| Immigrants | Iran | 100.0 /100 | #14 | Exceptional 9.7% |
| Indians (Asian) | 100.0 /100 | #15 | Exceptional 9.7% |
| Okinawans | 100.0 /100 | #16 | Exceptional 9.8% |
| Immigrants | Korea | 100.0 /100 | #17 | Exceptional 9.8% |
| Immigrants | Pakistan | 100.0 /100 | #18 | Exceptional 9.8% |
| Immigrants | Sri Lanka | 100.0 /100 | #19 | Exceptional 10.0% |
| Asians | 100.0 /100 | #20 | Exceptional 10.0% |
| Burmese | 100.0 /100 | #21 | Exceptional 10.0% |
| Immigrants | Venezuela | 100.0 /100 | #22 | Exceptional 10.0% |