Guyanese vs Immigrants from Micronesia Single Male Poverty
COMPARE
Guyanese
Immigrants from Micronesia
Single Male Poverty
Single Male Poverty Comparison
Guyanese
Immigrants from Micronesia
12.8%
SINGLE MALE POVERTY
52.0/ 100
METRIC RATING
170th/ 347
METRIC RANK
13.5%
SINGLE MALE POVERTY
1.2/ 100
METRIC RATING
246th/ 347
METRIC RANK
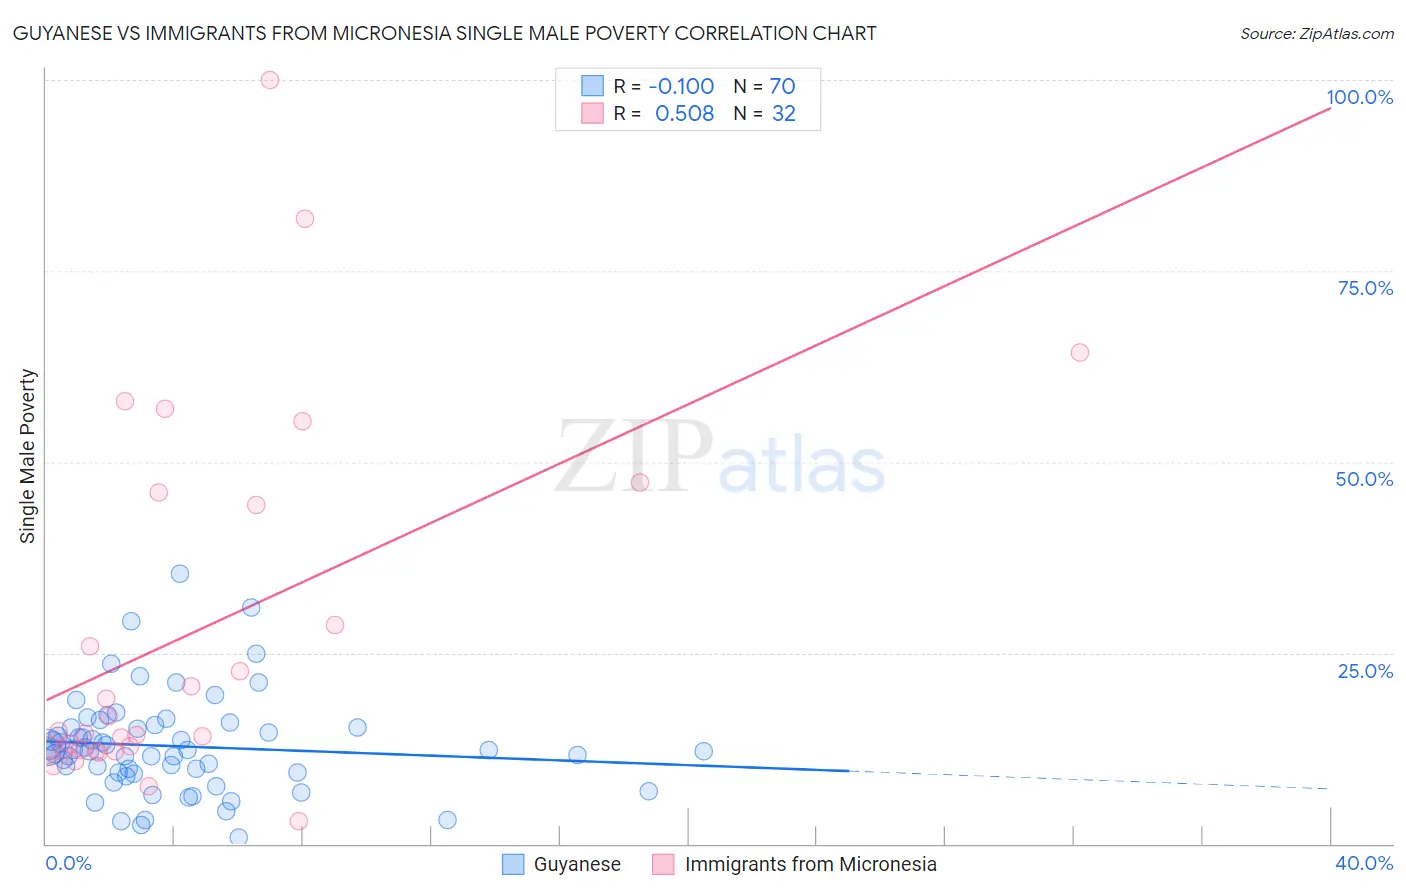
Guyanese vs Immigrants from Micronesia Single Male Poverty Correlation Chart
The statistical analysis conducted on geographies consisting of 165,156,840 people shows a poor negative correlation between the proportion of Guyanese and poverty level among single males in the United States with a correlation coefficient (R) of -0.100 and weighted average of 12.8%. Similarly, the statistical analysis conducted on geographies consisting of 60,290,539 people shows a substantial positive correlation between the proportion of Immigrants from Micronesia and poverty level among single males in the United States with a correlation coefficient (R) of 0.508 and weighted average of 13.5%, a difference of 5.9%.
Single Male Poverty Correlation Summary
| Measurement | Guyanese | Immigrants from Micronesia |
| Minimum | 0.85% | 3.0% |
| Maximum | 35.4% | 100.0% |
| Range | 34.6% | 97.0% |
| Mean | 12.8% | 27.8% |
| Median | 12.2% | 14.5% |
| Interquartile 25% (IQ1) | 9.3% | 12.2% |
| Interquartile 75% (IQ3) | 15.3% | 45.2% |
| Interquartile Range (IQR) | 5.9% | 32.9% |
| Standard Deviation (Sample) | 6.4% | 23.9% |
| Standard Deviation (Population) | 6.4% | 23.5% |
Similar Demographics by Single Male Poverty
Demographics Similar to Guyanese by Single Male Poverty
In terms of single male poverty, the demographic groups most similar to Guyanese are South African (12.8%, a difference of 0.030%), Danish (12.8%, a difference of 0.030%), Immigrants from St. Vincent and the Grenadines (12.8%, a difference of 0.060%), Costa Rican (12.8%, a difference of 0.10%), and Puget Sound Salish (12.8%, a difference of 0.12%).
| Demographics | Rating | Rank | Single Male Poverty |
| Palestinians | 63.1 /100 | #163 | Good 12.7% |
| Immigrants | Nigeria | 62.8 /100 | #164 | Good 12.7% |
| Immigrants | Cambodia | 62.2 /100 | #165 | Good 12.7% |
| Immigrants | Guyana | 60.5 /100 | #166 | Good 12.7% |
| Immigrants | Sudan | 58.2 /100 | #167 | Average 12.7% |
| Immigrants | Barbados | 57.7 /100 | #168 | Average 12.7% |
| Puget Sound Salish | 54.3 /100 | #169 | Average 12.8% |
| Guyanese | 52.0 /100 | #170 | Average 12.8% |
| South Africans | 51.5 /100 | #171 | Average 12.8% |
| Danes | 51.4 /100 | #172 | Average 12.8% |
| Immigrants | St. Vincent and the Grenadines | 50.9 /100 | #173 | Average 12.8% |
| Costa Ricans | 50.0 /100 | #174 | Average 12.8% |
| Croatians | 48.9 /100 | #175 | Average 12.8% |
| Syrians | 48.4 /100 | #176 | Average 12.8% |
| Immigrants | Canada | 44.8 /100 | #177 | Average 12.8% |
Demographics Similar to Immigrants from Micronesia by Single Male Poverty
In terms of single male poverty, the demographic groups most similar to Immigrants from Micronesia are Belgian (13.5%, a difference of 0.010%), Czech (13.5%, a difference of 0.040%), Immigrants from Latin America (13.5%, a difference of 0.10%), Spanish (13.6%, a difference of 0.28%), and Immigrants from Somalia (13.6%, a difference of 0.30%).
| Demographics | Rating | Rank | Single Male Poverty |
| Czechoslovakians | 3.0 /100 | #239 | Tragic 13.4% |
| Belizeans | 2.3 /100 | #240 | Tragic 13.4% |
| Immigrants | Germany | 2.1 /100 | #241 | Tragic 13.4% |
| Carpatho Rusyns | 2.1 /100 | #242 | Tragic 13.4% |
| Barbadians | 2.1 /100 | #243 | Tragic 13.4% |
| Immigrants | Senegal | 1.7 /100 | #244 | Tragic 13.5% |
| Immigrants | Latin America | 1.3 /100 | #245 | Tragic 13.5% |
| Immigrants | Micronesia | 1.2 /100 | #246 | Tragic 13.5% |
| Belgians | 1.2 /100 | #247 | Tragic 13.5% |
| Czechs | 1.2 /100 | #248 | Tragic 13.5% |
| Spanish | 1.0 /100 | #249 | Tragic 13.6% |
| Immigrants | Somalia | 1.0 /100 | #250 | Tragic 13.6% |
| Immigrants | Zaire | 0.9 /100 | #251 | Tragic 13.6% |
| Finns | 0.9 /100 | #252 | Tragic 13.6% |
| German Russians | 0.8 /100 | #253 | Tragic 13.6% |