Guamanian/Chamorro vs Immigrants from Zaire Male Disability
COMPARE
Guamanian/Chamorro
Immigrants from Zaire
Male Disability
Male Disability Comparison
Guamanians/Chamorros
Immigrants from Zaire
12.0%
MALE DISABILITY
0.5/ 100
METRIC RATING
253rd/ 347
METRIC RANK
11.4%
MALE DISABILITY
27.6/ 100
METRIC RATING
186th/ 347
METRIC RANK
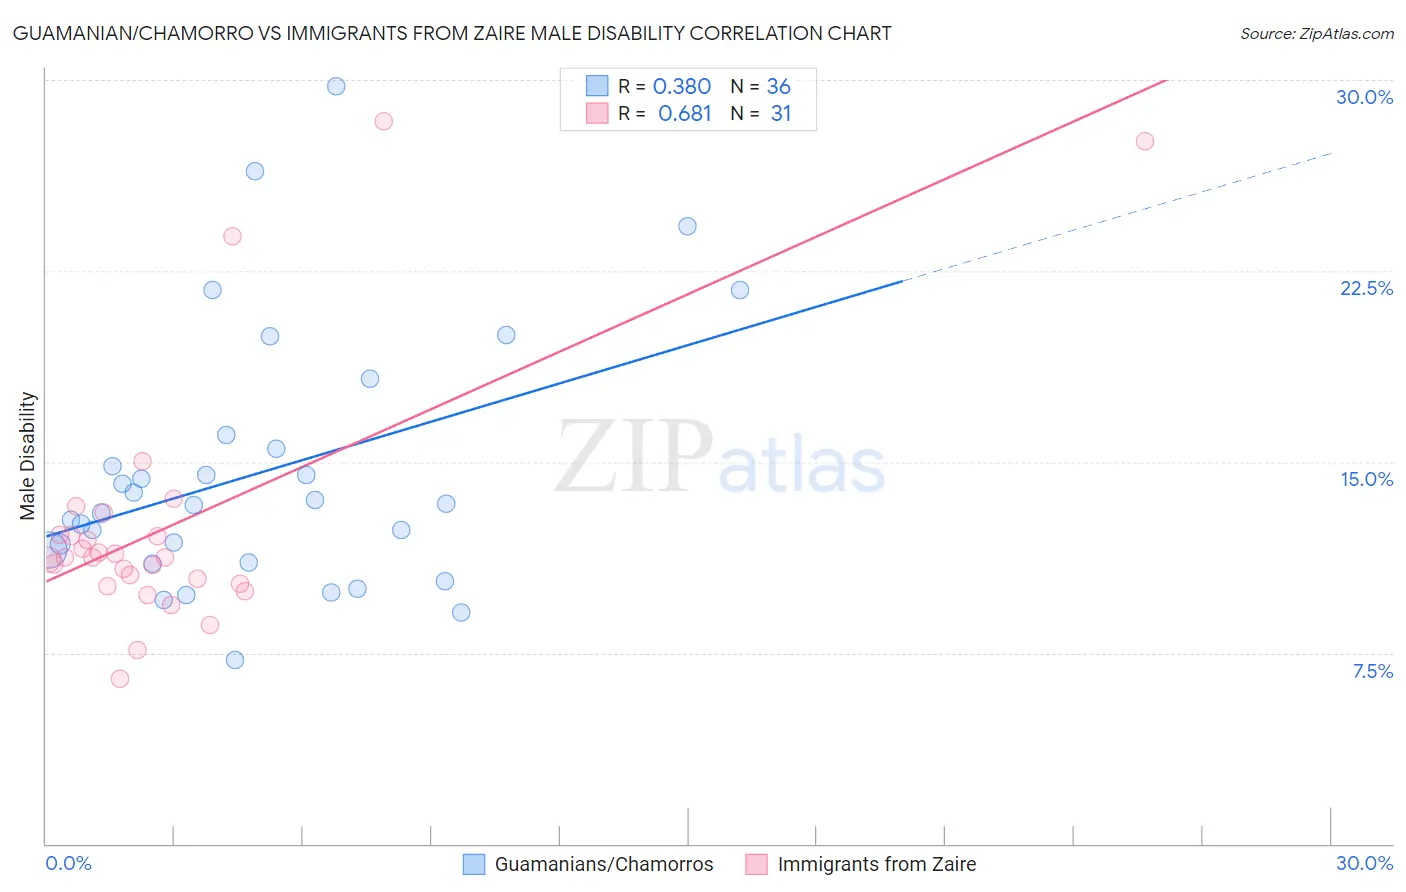
Guamanian/Chamorro vs Immigrants from Zaire Male Disability Correlation Chart
The statistical analysis conducted on geographies consisting of 221,895,319 people shows a mild positive correlation between the proportion of Guamanians/Chamorros and percentage of males with a disability in the United States with a correlation coefficient (R) of 0.380 and weighted average of 12.0%. Similarly, the statistical analysis conducted on geographies consisting of 107,255,080 people shows a significant positive correlation between the proportion of Immigrants from Zaire and percentage of males with a disability in the United States with a correlation coefficient (R) of 0.681 and weighted average of 11.4%, a difference of 5.9%.
Male Disability Correlation Summary
| Measurement | Guamanian/Chamorro | Immigrants from Zaire |
| Minimum | 7.2% | 6.5% |
| Maximum | 29.8% | 28.4% |
| Range | 22.5% | 21.9% |
| Mean | 14.6% | 12.5% |
| Median | 13.3% | 11.2% |
| Interquartile 25% (IQ1) | 11.3% | 10.2% |
| Interquartile 75% (IQ3) | 15.8% | 12.1% |
| Interquartile Range (IQR) | 4.5% | 1.9% |
| Standard Deviation (Sample) | 5.1% | 5.0% |
| Standard Deviation (Population) | 5.0% | 4.9% |
Similar Demographics by Male Disability
Demographics Similar to Guamanians/Chamorros by Male Disability
In terms of male disability, the demographic groups most similar to Guamanians/Chamorros are Slovene (12.0%, a difference of 0.0%), German Russian (12.0%, a difference of 0.070%), Bangladeshi (12.0%, a difference of 0.080%), Immigrants from Yemen (12.0%, a difference of 0.13%), and British (12.1%, a difference of 0.18%).
| Demographics | Rating | Rank | Male Disability |
| Danes | 0.9 /100 | #246 | Tragic 11.9% |
| Hungarians | 0.8 /100 | #247 | Tragic 12.0% |
| Poles | 0.7 /100 | #248 | Tragic 12.0% |
| Immigrants | Yemen | 0.5 /100 | #249 | Tragic 12.0% |
| Bangladeshis | 0.5 /100 | #250 | Tragic 12.0% |
| German Russians | 0.5 /100 | #251 | Tragic 12.0% |
| Slovenes | 0.5 /100 | #252 | Tragic 12.0% |
| Guamanians/Chamorros | 0.5 /100 | #253 | Tragic 12.0% |
| British | 0.4 /100 | #254 | Tragic 12.1% |
| Chinese | 0.4 /100 | #255 | Tragic 12.1% |
| Swiss | 0.3 /100 | #256 | Tragic 12.1% |
| Europeans | 0.3 /100 | #257 | Tragic 12.1% |
| Basques | 0.3 /100 | #258 | Tragic 12.1% |
| Belgians | 0.3 /100 | #259 | Tragic 12.1% |
| Swedes | 0.3 /100 | #260 | Tragic 12.1% |
Demographics Similar to Immigrants from Zaire by Male Disability
In terms of male disability, the demographic groups most similar to Immigrants from Zaire are Immigrants from Austria (11.4%, a difference of 0.020%), Estonian (11.4%, a difference of 0.060%), Immigrants from Netherlands (11.4%, a difference of 0.12%), Immigrants from Bosnia and Herzegovina (11.4%, a difference of 0.16%), and Pakistani (11.3%, a difference of 0.18%).
| Demographics | Rating | Rank | Male Disability |
| Immigrants | Caribbean | 41.4 /100 | #179 | Average 11.3% |
| Hondurans | 41.1 /100 | #180 | Average 11.3% |
| Immigrants | Senegal | 34.4 /100 | #181 | Fair 11.3% |
| Immigrants | Belize | 33.7 /100 | #182 | Fair 11.3% |
| Immigrants | Central America | 32.9 /100 | #183 | Fair 11.3% |
| Iraqis | 30.5 /100 | #184 | Fair 11.3% |
| Pakistanis | 30.3 /100 | #185 | Fair 11.3% |
| Immigrants | Zaire | 27.6 /100 | #186 | Fair 11.4% |
| Immigrants | Austria | 27.3 /100 | #187 | Fair 11.4% |
| Estonians | 26.8 /100 | #188 | Fair 11.4% |
| Immigrants | Netherlands | 25.9 /100 | #189 | Fair 11.4% |
| Immigrants | Bosnia and Herzegovina | 25.4 /100 | #190 | Fair 11.4% |
| Senegalese | 23.2 /100 | #191 | Fair 11.4% |
| Assyrians/Chaldeans/Syriacs | 23.2 /100 | #192 | Fair 11.4% |
| Greeks | 22.2 /100 | #193 | Fair 11.4% |