Guamanian/Chamorro vs Ugandan 10th Grade
COMPARE
Guamanian/Chamorro
Ugandan
10th Grade
10th Grade Comparison
Guamanians/Chamorros
Ugandans
93.6%
10TH GRADE
37.1/ 100
METRIC RATING
183rd/ 347
METRIC RANK
94.0%
10TH GRADE
80.7/ 100
METRIC RATING
149th/ 347
METRIC RANK
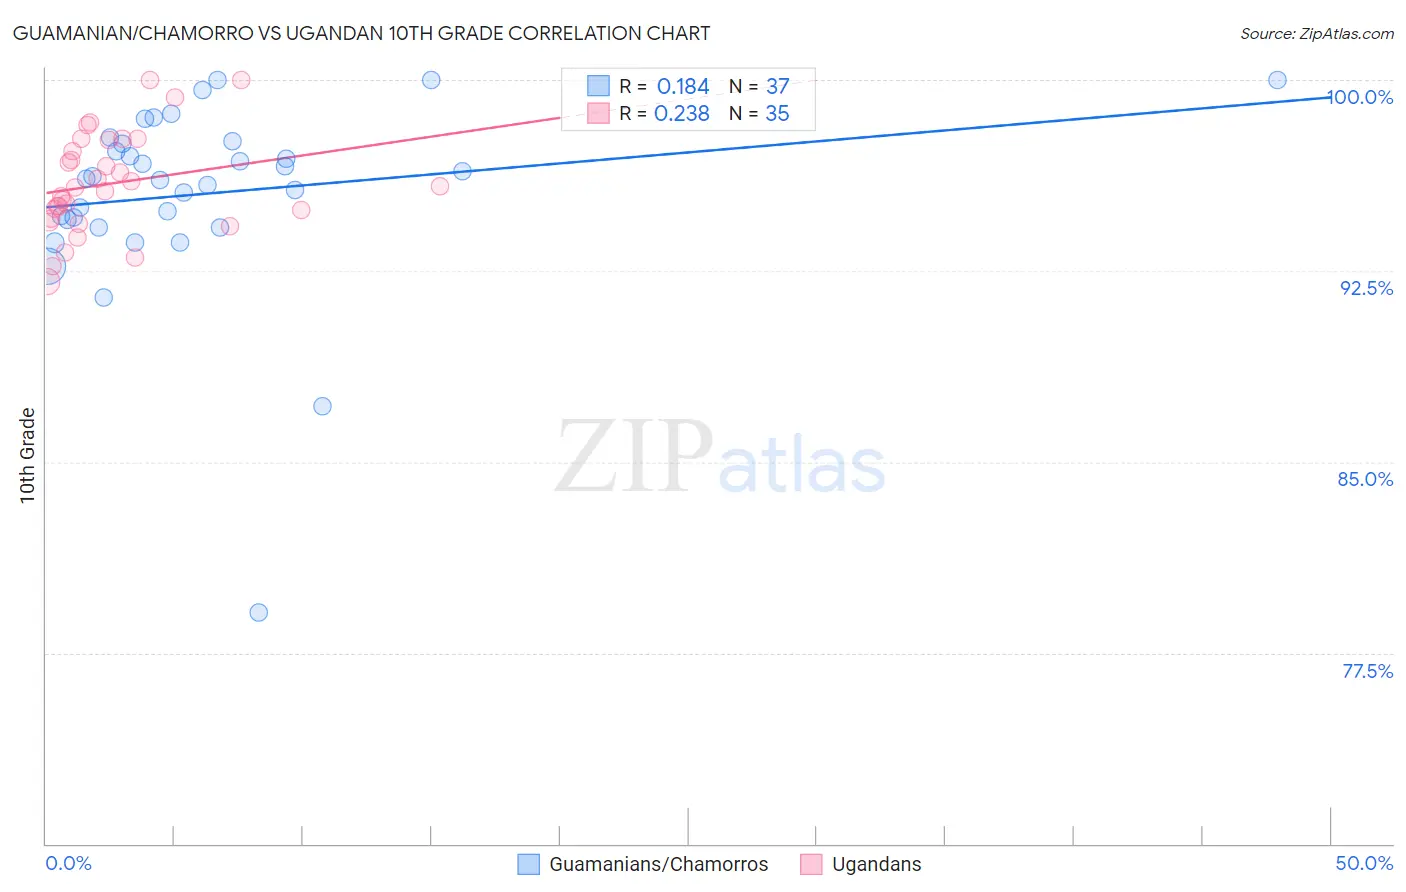
Guamanian/Chamorro vs Ugandan 10th Grade Correlation Chart
The statistical analysis conducted on geographies consisting of 221,965,618 people shows a poor positive correlation between the proportion of Guamanians/Chamorros and percentage of population with at least 10th grade education in the United States with a correlation coefficient (R) of 0.184 and weighted average of 93.6%. Similarly, the statistical analysis conducted on geographies consisting of 93,990,882 people shows a weak positive correlation between the proportion of Ugandans and percentage of population with at least 10th grade education in the United States with a correlation coefficient (R) of 0.238 and weighted average of 94.0%, a difference of 0.44%.
10th Grade Correlation Summary
| Measurement | Guamanian/Chamorro | Ugandan |
| Minimum | 79.1% | 92.1% |
| Maximum | 100.0% | 100.0% |
| Range | 20.9% | 7.9% |
| Mean | 95.5% | 95.9% |
| Median | 96.1% | 95.8% |
| Interquartile 25% (IQ1) | 94.4% | 94.6% |
| Interquartile 75% (IQ3) | 97.5% | 97.6% |
| Interquartile Range (IQR) | 3.2% | 3.1% |
| Standard Deviation (Sample) | 3.8% | 2.0% |
| Standard Deviation (Population) | 3.7% | 1.9% |
Similar Demographics by 10th Grade
Demographics Similar to Guamanians/Chamorros by 10th Grade
In terms of 10th grade, the demographic groups most similar to Guamanians/Chamorros are Choctaw (93.6%, a difference of 0.0%), Sudanese (93.6%, a difference of 0.0%), Colville (93.6%, a difference of 0.020%), Immigrants from Eastern Asia (93.6%, a difference of 0.020%), and Liberian (93.6%, a difference of 0.020%).
| Demographics | Rating | Rank | 10th Grade |
| Immigrants | Argentina | 47.1 /100 | #176 | Average 93.7% |
| Immigrants | Lebanon | 47.1 /100 | #177 | Average 93.7% |
| Sierra Leoneans | 46.1 /100 | #178 | Average 93.7% |
| Paraguayans | 45.3 /100 | #179 | Average 93.7% |
| Blackfeet | 42.8 /100 | #180 | Average 93.7% |
| Immigrants | Northern Africa | 41.6 /100 | #181 | Average 93.7% |
| Colville | 38.8 /100 | #182 | Fair 93.6% |
| Guamanians/Chamorros | 37.1 /100 | #183 | Fair 93.6% |
| Choctaw | 36.6 /100 | #184 | Fair 93.6% |
| Sudanese | 36.6 /100 | #185 | Fair 93.6% |
| Immigrants | Eastern Asia | 35.1 /100 | #186 | Fair 93.6% |
| Liberians | 34.7 /100 | #187 | Fair 93.6% |
| Marshallese | 33.2 /100 | #188 | Fair 93.6% |
| Immigrants | Pakistan | 32.5 /100 | #189 | Fair 93.6% |
| Laotians | 32.1 /100 | #190 | Fair 93.6% |
Demographics Similar to Ugandans by 10th Grade
In terms of 10th grade, the demographic groups most similar to Ugandans are Arab (94.0%, a difference of 0.0%), Immigrants from Ukraine (94.0%, a difference of 0.010%), Egyptian (94.0%, a difference of 0.020%), Kenyan (94.0%, a difference of 0.020%), and Chickasaw (94.1%, a difference of 0.030%).
| Demographics | Rating | Rank | 10th Grade |
| Albanians | 86.5 /100 | #142 | Excellent 94.1% |
| Cherokee | 84.9 /100 | #143 | Excellent 94.1% |
| Immigrants | Kazakhstan | 84.9 /100 | #144 | Excellent 94.1% |
| Immigrants | Nonimmigrants | 83.8 /100 | #145 | Excellent 94.1% |
| Chickasaw | 82.6 /100 | #146 | Excellent 94.1% |
| Immigrants | Ukraine | 81.5 /100 | #147 | Excellent 94.0% |
| Arabs | 80.9 /100 | #148 | Excellent 94.0% |
| Ugandans | 80.7 /100 | #149 | Excellent 94.0% |
| Egyptians | 79.6 /100 | #150 | Good 94.0% |
| Kenyans | 79.1 /100 | #151 | Good 94.0% |
| Immigrants | Italy | 78.0 /100 | #152 | Good 94.0% |
| Immigrants | Brazil | 75.5 /100 | #153 | Good 94.0% |
| Immigrants | Kenya | 75.3 /100 | #154 | Good 94.0% |
| Spanish | 74.9 /100 | #155 | Good 94.0% |
| Mongolians | 74.4 /100 | #156 | Good 94.0% |