Immigrants from Russia vs Pima Disability Age 65 to 74
COMPARE
Immigrants from Russia
Pima
Disability Age 65 to 74
Disability Age 65 to 74 Comparison
Immigrants from Russia
Pima
21.6%
DISABILITY AGE 65 TO 74
99.4/ 100
METRIC RATING
65th/ 347
METRIC RANK
38.6%
DISABILITY AGE 65 TO 74
0.0/ 100
METRIC RATING
347th/ 347
METRIC RANK
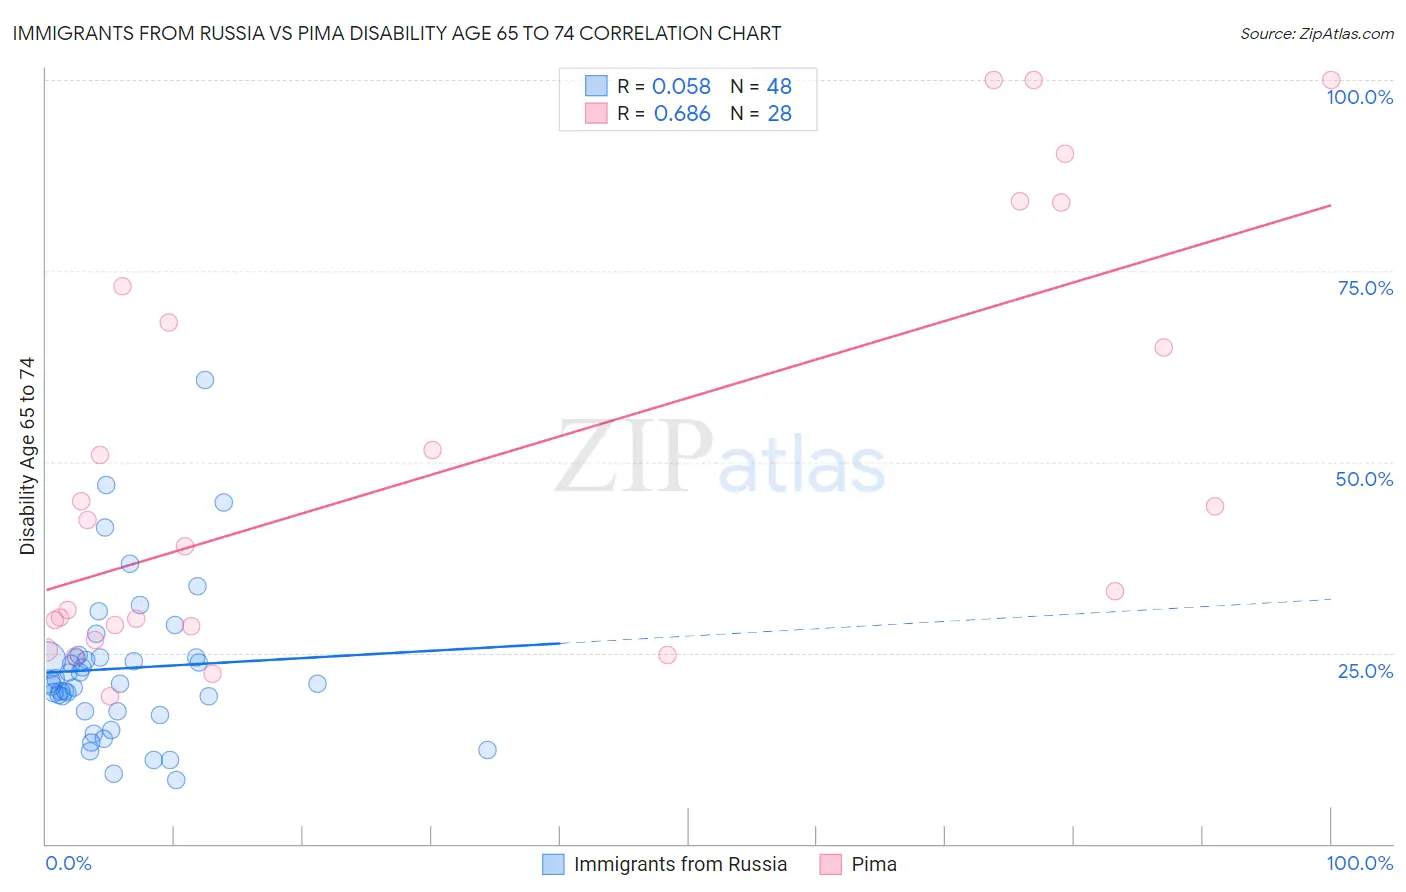
Immigrants from Russia vs Pima Disability Age 65 to 74 Correlation Chart
The statistical analysis conducted on geographies consisting of 347,329,663 people shows a slight positive correlation between the proportion of Immigrants from Russia and percentage of population with a disability between the ages 65 and 75 in the United States with a correlation coefficient (R) of 0.058 and weighted average of 21.6%. Similarly, the statistical analysis conducted on geographies consisting of 61,525,025 people shows a significant positive correlation between the proportion of Pima and percentage of population with a disability between the ages 65 and 75 in the United States with a correlation coefficient (R) of 0.686 and weighted average of 38.6%, a difference of 78.7%.
Disability Age 65 to 74 Correlation Summary
| Measurement | Immigrants from Russia | Pima |
| Minimum | 8.3% | 19.4% |
| Maximum | 60.7% | 100.0% |
| Range | 52.4% | 80.6% |
| Mean | 23.0% | 49.6% |
| Median | 21.1% | 40.6% |
| Interquartile 25% (IQ1) | 17.3% | 28.5% |
| Interquartile 75% (IQ3) | 24.4% | 70.6% |
| Interquartile Range (IQR) | 7.1% | 42.1% |
| Standard Deviation (Sample) | 10.1% | 27.1% |
| Standard Deviation (Population) | 10.0% | 26.6% |
Similar Demographics by Disability Age 65 to 74
Demographics Similar to Immigrants from Russia by Disability Age 65 to 74
In terms of disability age 65 to 74, the demographic groups most similar to Immigrants from Russia are Immigrants from Latvia (21.6%, a difference of 0.010%), Maltese (21.6%, a difference of 0.010%), Immigrants from Europe (21.6%, a difference of 0.090%), Carpatho Rusyn (21.6%, a difference of 0.19%), and Egyptian (21.6%, a difference of 0.22%).
| Demographics | Rating | Rank | Disability Age 65 to 74 |
| Immigrants | Pakistan | 99.5 /100 | #58 | Exceptional 21.5% |
| Zimbabweans | 99.5 /100 | #59 | Exceptional 21.5% |
| Immigrants | North Macedonia | 99.5 /100 | #60 | Exceptional 21.6% |
| Egyptians | 99.5 /100 | #61 | Exceptional 21.6% |
| Carpatho Rusyns | 99.5 /100 | #62 | Exceptional 21.6% |
| Immigrants | Europe | 99.4 /100 | #63 | Exceptional 21.6% |
| Immigrants | Latvia | 99.4 /100 | #64 | Exceptional 21.6% |
| Immigrants | Russia | 99.4 /100 | #65 | Exceptional 21.6% |
| Maltese | 99.4 /100 | #66 | Exceptional 21.6% |
| Immigrants | South Africa | 99.3 /100 | #67 | Exceptional 21.7% |
| Immigrants | Scotland | 99.3 /100 | #68 | Exceptional 21.7% |
| Immigrants | Egypt | 99.2 /100 | #69 | Exceptional 21.7% |
| Chinese | 99.2 /100 | #70 | Exceptional 21.7% |
| Immigrants | Belarus | 99.2 /100 | #71 | Exceptional 21.7% |
| Immigrants | Hungary | 99.2 /100 | #72 | Exceptional 21.7% |
Demographics Similar to Pima by Disability Age 65 to 74
In terms of disability age 65 to 74, the demographic groups most similar to Pima are Yup'ik (37.8%, a difference of 2.0%), Tohono O'odham (36.0%, a difference of 7.1%), Inupiat (34.5%, a difference of 11.8%), Navajo (33.3%, a difference of 15.8%), and Pueblo (33.1%, a difference of 16.7%).
| Demographics | Rating | Rank | Disability Age 65 to 74 |
| Colville | 0.0 /100 | #333 | Tragic 30.5% |
| Alaska Natives | 0.0 /100 | #334 | Tragic 30.6% |
| Cheyenne | 0.0 /100 | #335 | Tragic 31.1% |
| Yuman | 0.0 /100 | #336 | Tragic 31.5% |
| Houma | 0.0 /100 | #337 | Tragic 32.3% |
| Alaskan Athabascans | 0.0 /100 | #338 | Tragic 32.4% |
| Kiowa | 0.0 /100 | #339 | Tragic 32.6% |
| Lumbee | 0.0 /100 | #340 | Tragic 32.7% |
| Tsimshian | 0.0 /100 | #341 | Tragic 32.9% |
| Pueblo | 0.0 /100 | #342 | Tragic 33.1% |
| Navajo | 0.0 /100 | #343 | Tragic 33.3% |
| Inupiat | 0.0 /100 | #344 | Tragic 34.5% |
| Tohono O'odham | 0.0 /100 | #345 | Tragic 36.0% |
| Yup'ik | 0.0 /100 | #346 | Tragic 37.8% |
| Pima | 0.0 /100 | #347 | Tragic 38.6% |