Immigrants from Somalia vs Immigrants from Philippines Disability Age Over 75
COMPARE
Immigrants from Somalia
Immigrants from Philippines
Disability Age Over 75
Disability Age Over 75 Comparison
Immigrants from Somalia
Immigrants from Philippines
47.7%
DISABILITY AGE OVER 75
21.4/ 100
METRIC RATING
200th/ 347
METRIC RANK
48.8%
DISABILITY AGE OVER 75
0.4/ 100
METRIC RATING
258th/ 347
METRIC RANK
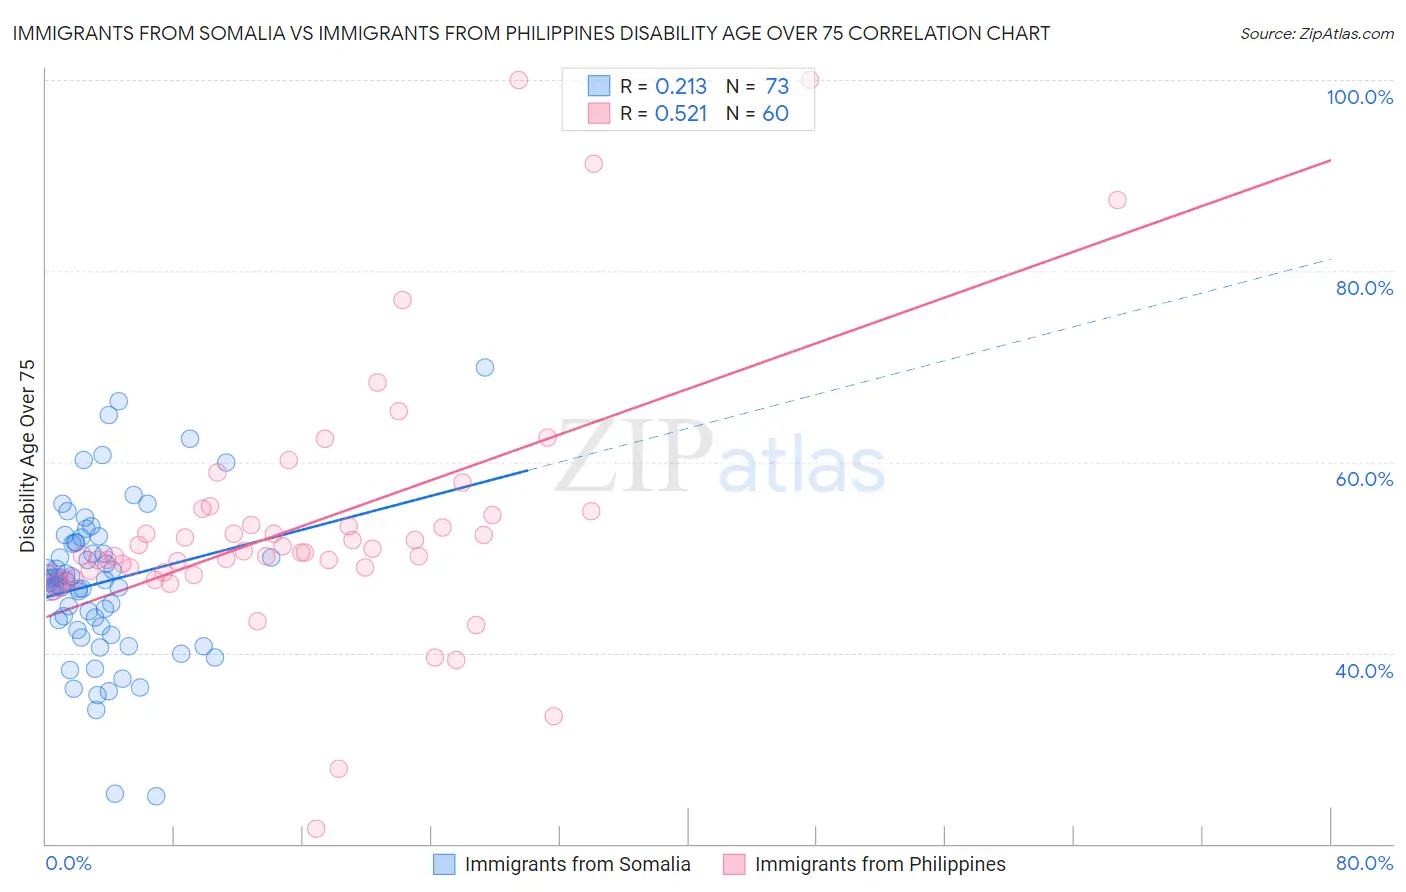
Immigrants from Somalia vs Immigrants from Philippines Disability Age Over 75 Correlation Chart
The statistical analysis conducted on geographies consisting of 92,093,367 people shows a weak positive correlation between the proportion of Immigrants from Somalia and percentage of population with a disability over the age of 75 in the United States with a correlation coefficient (R) of 0.213 and weighted average of 47.7%. Similarly, the statistical analysis conducted on geographies consisting of 470,204,891 people shows a substantial positive correlation between the proportion of Immigrants from Philippines and percentage of population with a disability over the age of 75 in the United States with a correlation coefficient (R) of 0.521 and weighted average of 48.8%, a difference of 2.3%.
Disability Age Over 75 Correlation Summary
| Measurement | Immigrants from Somalia | Immigrants from Philippines |
| Minimum | 25.0% | 21.6% |
| Maximum | 69.9% | 100.0% |
| Range | 44.9% | 78.4% |
| Mean | 47.4% | 53.6% |
| Median | 47.6% | 50.6% |
| Interquartile 25% (IQ1) | 42.6% | 48.5% |
| Interquartile 75% (IQ3) | 51.6% | 54.6% |
| Interquartile Range (IQR) | 9.0% | 6.2% |
| Standard Deviation (Sample) | 8.2% | 13.8% |
| Standard Deviation (Population) | 8.2% | 13.7% |
Similar Demographics by Disability Age Over 75
Demographics Similar to Immigrants from Somalia by Disability Age Over 75
In terms of disability age over 75, the demographic groups most similar to Immigrants from Somalia are Immigrants from Cuba (47.7%, a difference of 0.020%), Immigrants from Bahamas (47.7%, a difference of 0.020%), Immigrants from Eritrea (47.7%, a difference of 0.030%), Trinidadian and Tobagonian (47.7%, a difference of 0.050%), and Immigrants from Ukraine (47.7%, a difference of 0.060%).
| Demographics | Rating | Rank | Disability Age Over 75 |
| Ottawa | 28.1 /100 | #193 | Fair 47.6% |
| Immigrants | Lebanon | 26.5 /100 | #194 | Fair 47.6% |
| Immigrants | Trinidad and Tobago | 25.3 /100 | #195 | Fair 47.6% |
| Immigrants | Portugal | 23.8 /100 | #196 | Fair 47.6% |
| Pakistanis | 23.4 /100 | #197 | Fair 47.7% |
| Immigrants | Ukraine | 23.2 /100 | #198 | Fair 47.7% |
| Immigrants | Eritrea | 22.4 /100 | #199 | Fair 47.7% |
| Immigrants | Somalia | 21.4 /100 | #200 | Fair 47.7% |
| Immigrants | Cuba | 20.9 /100 | #201 | Fair 47.7% |
| Immigrants | Bahamas | 20.7 /100 | #202 | Fair 47.7% |
| Trinidadians and Tobagonians | 20.0 /100 | #203 | Fair 47.7% |
| Nigerians | 19.2 /100 | #204 | Poor 47.7% |
| Immigrants | Ghana | 19.1 /100 | #205 | Poor 47.7% |
| Jamaicans | 19.0 /100 | #206 | Poor 47.7% |
| Immigrants | Syria | 17.4 /100 | #207 | Poor 47.8% |
Demographics Similar to Immigrants from Philippines by Disability Age Over 75
In terms of disability age over 75, the demographic groups most similar to Immigrants from Philippines are Blackfeet (48.8%, a difference of 0.040%), Central American (48.8%, a difference of 0.070%), Immigrants from Congo (48.7%, a difference of 0.090%), Chinese (48.7%, a difference of 0.10%), and Immigrants from Afghanistan (48.8%, a difference of 0.11%).
| Demographics | Rating | Rank | Disability Age Over 75 |
| Koreans | 0.8 /100 | #251 | Tragic 48.6% |
| Immigrants | South Eastern Asia | 0.7 /100 | #252 | Tragic 48.7% |
| British West Indians | 0.6 /100 | #253 | Tragic 48.7% |
| Immigrants | Vietnam | 0.6 /100 | #254 | Tragic 48.7% |
| Chinese | 0.5 /100 | #255 | Tragic 48.7% |
| Immigrants | Congo | 0.5 /100 | #256 | Tragic 48.7% |
| Blackfeet | 0.5 /100 | #257 | Tragic 48.8% |
| Immigrants | Philippines | 0.4 /100 | #258 | Tragic 48.8% |
| Central Americans | 0.4 /100 | #259 | Tragic 48.8% |
| Immigrants | Afghanistan | 0.4 /100 | #260 | Tragic 48.8% |
| Africans | 0.3 /100 | #261 | Tragic 48.9% |
| Immigrants | West Indies | 0.3 /100 | #262 | Tragic 48.9% |
| Salvadorans | 0.3 /100 | #263 | Tragic 48.9% |
| Immigrants | Honduras | 0.3 /100 | #264 | Tragic 48.9% |
| Hondurans | 0.3 /100 | #265 | Tragic 48.9% |