Trinidadian and Tobagonian vs Alaska Native Disability Age Over 75
COMPARE
Trinidadian and Tobagonian
Alaska Native
Disability Age Over 75
Disability Age Over 75 Comparison
Trinidadians and Tobagonians
Alaska Natives
47.7%
DISABILITY AGE OVER 75
20.0/ 100
METRIC RATING
203rd/ 347
METRIC RANK
52.8%
DISABILITY AGE OVER 75
0.0/ 100
METRIC RATING
329th/ 347
METRIC RANK
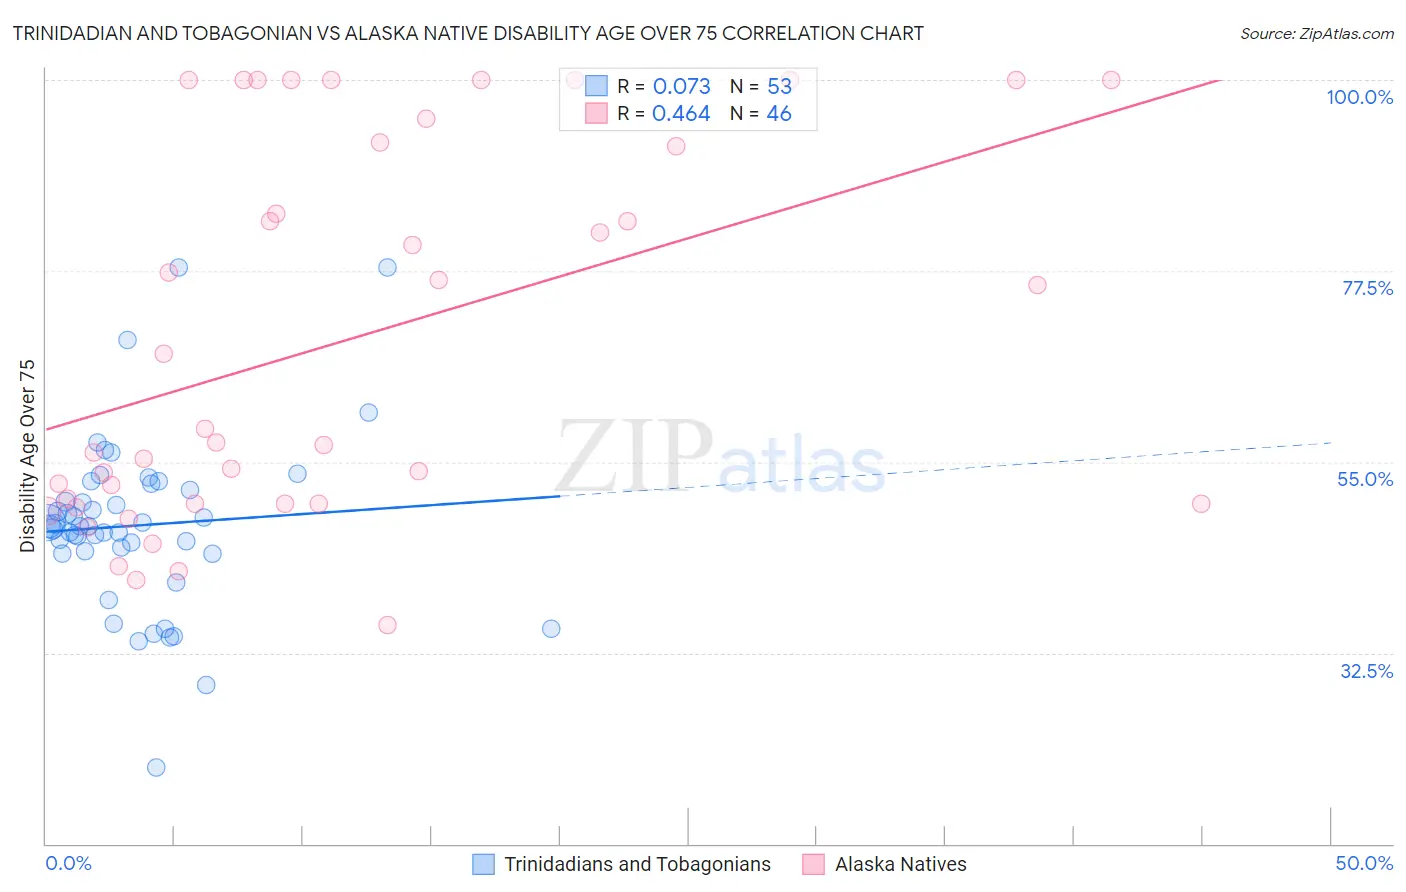
Trinidadian and Tobagonian vs Alaska Native Disability Age Over 75 Correlation Chart
The statistical analysis conducted on geographies consisting of 219,483,630 people shows a slight positive correlation between the proportion of Trinidadians and Tobagonians and percentage of population with a disability over the age of 75 in the United States with a correlation coefficient (R) of 0.073 and weighted average of 47.7%. Similarly, the statistical analysis conducted on geographies consisting of 76,686,010 people shows a moderate positive correlation between the proportion of Alaska Natives and percentage of population with a disability over the age of 75 in the United States with a correlation coefficient (R) of 0.464 and weighted average of 52.8%, a difference of 10.7%.
Disability Age Over 75 Correlation Summary
| Measurement | Trinidadian and Tobagonian | Alaska Native |
| Minimum | 18.9% | 35.7% |
| Maximum | 77.9% | 100.0% |
| Range | 59.0% | 64.3% |
| Mean | 47.5% | 69.4% |
| Median | 47.4% | 58.1% |
| Interquartile 25% (IQ1) | 44.3% | 50.0% |
| Interquartile 75% (IQ3) | 52.0% | 92.6% |
| Interquartile Range (IQR) | 7.7% | 42.6% |
| Standard Deviation (Sample) | 10.2% | 22.0% |
| Standard Deviation (Population) | 10.1% | 21.8% |
Similar Demographics by Disability Age Over 75
Demographics Similar to Trinidadians and Tobagonians by Disability Age Over 75
In terms of disability age over 75, the demographic groups most similar to Trinidadians and Tobagonians are Immigrants from Bahamas (47.7%, a difference of 0.020%), Immigrants from Cuba (47.7%, a difference of 0.030%), Nigerian (47.7%, a difference of 0.030%), Immigrants from Ghana (47.7%, a difference of 0.030%), and Jamaican (47.7%, a difference of 0.040%).
| Demographics | Rating | Rank | Disability Age Over 75 |
| Immigrants | Portugal | 23.8 /100 | #196 | Fair 47.6% |
| Pakistanis | 23.4 /100 | #197 | Fair 47.7% |
| Immigrants | Ukraine | 23.2 /100 | #198 | Fair 47.7% |
| Immigrants | Eritrea | 22.4 /100 | #199 | Fair 47.7% |
| Immigrants | Somalia | 21.4 /100 | #200 | Fair 47.7% |
| Immigrants | Cuba | 20.9 /100 | #201 | Fair 47.7% |
| Immigrants | Bahamas | 20.7 /100 | #202 | Fair 47.7% |
| Trinidadians and Tobagonians | 20.0 /100 | #203 | Fair 47.7% |
| Nigerians | 19.2 /100 | #204 | Poor 47.7% |
| Immigrants | Ghana | 19.1 /100 | #205 | Poor 47.7% |
| Jamaicans | 19.0 /100 | #206 | Poor 47.7% |
| Immigrants | Syria | 17.4 /100 | #207 | Poor 47.8% |
| Immigrants | Senegal | 16.9 /100 | #208 | Poor 47.8% |
| Immigrants | Indonesia | 14.2 /100 | #209 | Poor 47.8% |
| Vietnamese | 11.9 /100 | #210 | Poor 47.9% |
Demographics Similar to Alaska Natives by Disability Age Over 75
In terms of disability age over 75, the demographic groups most similar to Alaska Natives are Puerto Rican (52.9%, a difference of 0.18%), Hopi (52.9%, a difference of 0.19%), Choctaw (52.7%, a difference of 0.22%), Nepalese (52.6%, a difference of 0.41%), and Ute (52.6%, a difference of 0.44%).
| Demographics | Rating | Rank | Disability Age Over 75 |
| Comanche | 0.0 /100 | #322 | Tragic 51.7% |
| Immigrants | Yemen | 0.0 /100 | #323 | Tragic 52.0% |
| Menominee | 0.0 /100 | #324 | Tragic 52.3% |
| Immigrants | Cabo Verde | 0.0 /100 | #325 | Tragic 52.4% |
| Ute | 0.0 /100 | #326 | Tragic 52.6% |
| Nepalese | 0.0 /100 | #327 | Tragic 52.6% |
| Choctaw | 0.0 /100 | #328 | Tragic 52.7% |
| Alaska Natives | 0.0 /100 | #329 | Tragic 52.8% |
| Puerto Ricans | 0.0 /100 | #330 | Tragic 52.9% |
| Hopi | 0.0 /100 | #331 | Tragic 52.9% |
| Natives/Alaskans | 0.0 /100 | #332 | Tragic 53.1% |
| Apache | 0.0 /100 | #333 | Tragic 53.6% |
| Alaskan Athabascans | 0.0 /100 | #334 | Tragic 54.0% |
| Kiowa | 0.0 /100 | #335 | Tragic 54.2% |
| Immigrants | Armenia | 0.0 /100 | #336 | Tragic 54.3% |