Immigrants from Brazil vs Alaska Native Disability Age Over 75
COMPARE
Immigrants from Brazil
Alaska Native
Disability Age Over 75
Disability Age Over 75 Comparison
Immigrants from Brazil
Alaska Natives
46.3%
DISABILITY AGE OVER 75
98.0/ 100
METRIC RATING
95th/ 347
METRIC RANK
52.8%
DISABILITY AGE OVER 75
0.0/ 100
METRIC RATING
329th/ 347
METRIC RANK
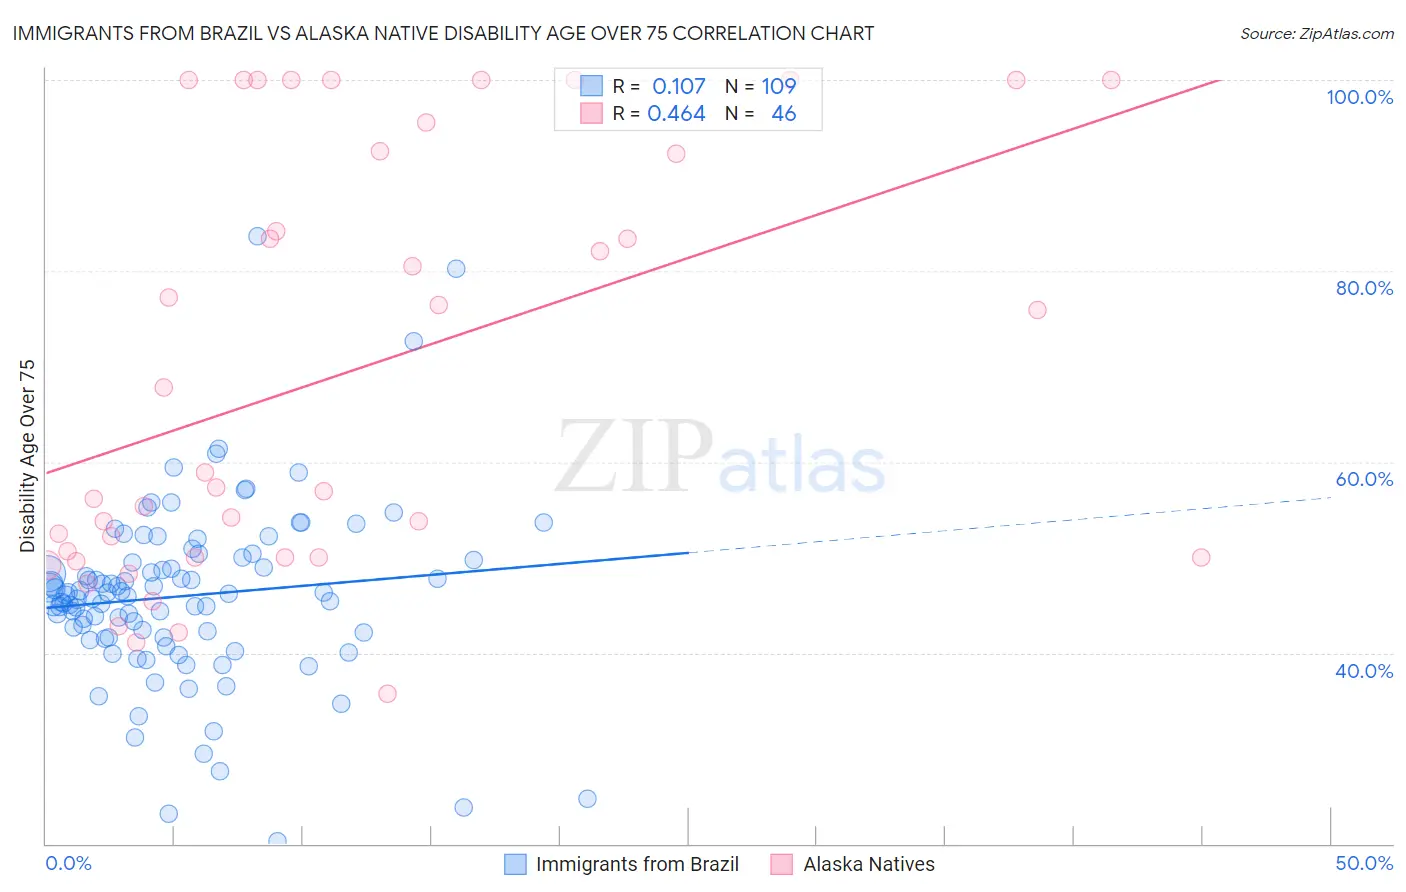
Immigrants from Brazil vs Alaska Native Disability Age Over 75 Correlation Chart
The statistical analysis conducted on geographies consisting of 342,544,403 people shows a poor positive correlation between the proportion of Immigrants from Brazil and percentage of population with a disability over the age of 75 in the United States with a correlation coefficient (R) of 0.107 and weighted average of 46.3%. Similarly, the statistical analysis conducted on geographies consisting of 76,686,010 people shows a moderate positive correlation between the proportion of Alaska Natives and percentage of population with a disability over the age of 75 in the United States with a correlation coefficient (R) of 0.464 and weighted average of 52.8%, a difference of 14.0%.
Disability Age Over 75 Correlation Summary
| Measurement | Immigrants from Brazil | Alaska Native |
| Minimum | 20.2% | 35.7% |
| Maximum | 83.7% | 100.0% |
| Range | 63.4% | 64.3% |
| Mean | 46.0% | 69.4% |
| Median | 46.1% | 58.1% |
| Interquartile 25% (IQ1) | 41.7% | 50.0% |
| Interquartile 75% (IQ3) | 49.8% | 92.6% |
| Interquartile Range (IQR) | 8.2% | 42.6% |
| Standard Deviation (Sample) | 9.5% | 22.0% |
| Standard Deviation (Population) | 9.5% | 21.8% |
Similar Demographics by Disability Age Over 75
Demographics Similar to Immigrants from Brazil by Disability Age Over 75
In terms of disability age over 75, the demographic groups most similar to Immigrants from Brazil are Immigrants from China (46.3%, a difference of 0.010%), Albanian (46.3%, a difference of 0.030%), Finnish (46.3%, a difference of 0.030%), Immigrants from Japan (46.3%, a difference of 0.040%), and German (46.3%, a difference of 0.060%).
| Demographics | Rating | Rank | Disability Age Over 75 |
| Uruguayans | 98.4 /100 | #88 | Exceptional 46.2% |
| Immigrants | Saudi Arabia | 98.4 /100 | #89 | Exceptional 46.3% |
| Northern Europeans | 98.3 /100 | #90 | Exceptional 46.3% |
| Immigrants | Egypt | 98.3 /100 | #91 | Exceptional 46.3% |
| Germans | 98.2 /100 | #92 | Exceptional 46.3% |
| Ugandans | 98.2 /100 | #93 | Exceptional 46.3% |
| Albanians | 98.1 /100 | #94 | Exceptional 46.3% |
| Immigrants | Brazil | 98.0 /100 | #95 | Exceptional 46.3% |
| Immigrants | China | 98.0 /100 | #96 | Exceptional 46.3% |
| Finns | 97.9 /100 | #97 | Exceptional 46.3% |
| Immigrants | Japan | 97.8 /100 | #98 | Exceptional 46.3% |
| Palestinians | 97.7 /100 | #99 | Exceptional 46.3% |
| Immigrants | Eastern Europe | 97.7 /100 | #100 | Exceptional 46.3% |
| Mongolians | 97.7 /100 | #101 | Exceptional 46.3% |
| Immigrants | Malaysia | 97.1 /100 | #102 | Exceptional 46.4% |
Demographics Similar to Alaska Natives by Disability Age Over 75
In terms of disability age over 75, the demographic groups most similar to Alaska Natives are Puerto Rican (52.9%, a difference of 0.18%), Hopi (52.9%, a difference of 0.19%), Choctaw (52.7%, a difference of 0.22%), Nepalese (52.6%, a difference of 0.41%), and Ute (52.6%, a difference of 0.44%).
| Demographics | Rating | Rank | Disability Age Over 75 |
| Comanche | 0.0 /100 | #322 | Tragic 51.7% |
| Immigrants | Yemen | 0.0 /100 | #323 | Tragic 52.0% |
| Menominee | 0.0 /100 | #324 | Tragic 52.3% |
| Immigrants | Cabo Verde | 0.0 /100 | #325 | Tragic 52.4% |
| Ute | 0.0 /100 | #326 | Tragic 52.6% |
| Nepalese | 0.0 /100 | #327 | Tragic 52.6% |
| Choctaw | 0.0 /100 | #328 | Tragic 52.7% |
| Alaska Natives | 0.0 /100 | #329 | Tragic 52.8% |
| Puerto Ricans | 0.0 /100 | #330 | Tragic 52.9% |
| Hopi | 0.0 /100 | #331 | Tragic 52.9% |
| Natives/Alaskans | 0.0 /100 | #332 | Tragic 53.1% |
| Apache | 0.0 /100 | #333 | Tragic 53.6% |
| Alaskan Athabascans | 0.0 /100 | #334 | Tragic 54.0% |
| Kiowa | 0.0 /100 | #335 | Tragic 54.2% |
| Immigrants | Armenia | 0.0 /100 | #336 | Tragic 54.3% |