Blackfeet vs Immigrants from Honduras Disability Age 5 to 17
COMPARE
Blackfeet
Immigrants from Honduras
Disability Age 5 to 17
Disability Age 5 to 17 Comparison
Blackfeet
Immigrants from Honduras
6.6%
DISABILITY AGE 5 TO 17
0.0/ 100
METRIC RATING
329th/ 347
METRIC RANK
5.9%
DISABILITY AGE 5 TO 17
1.8/ 100
METRIC RATING
247th/ 347
METRIC RANK
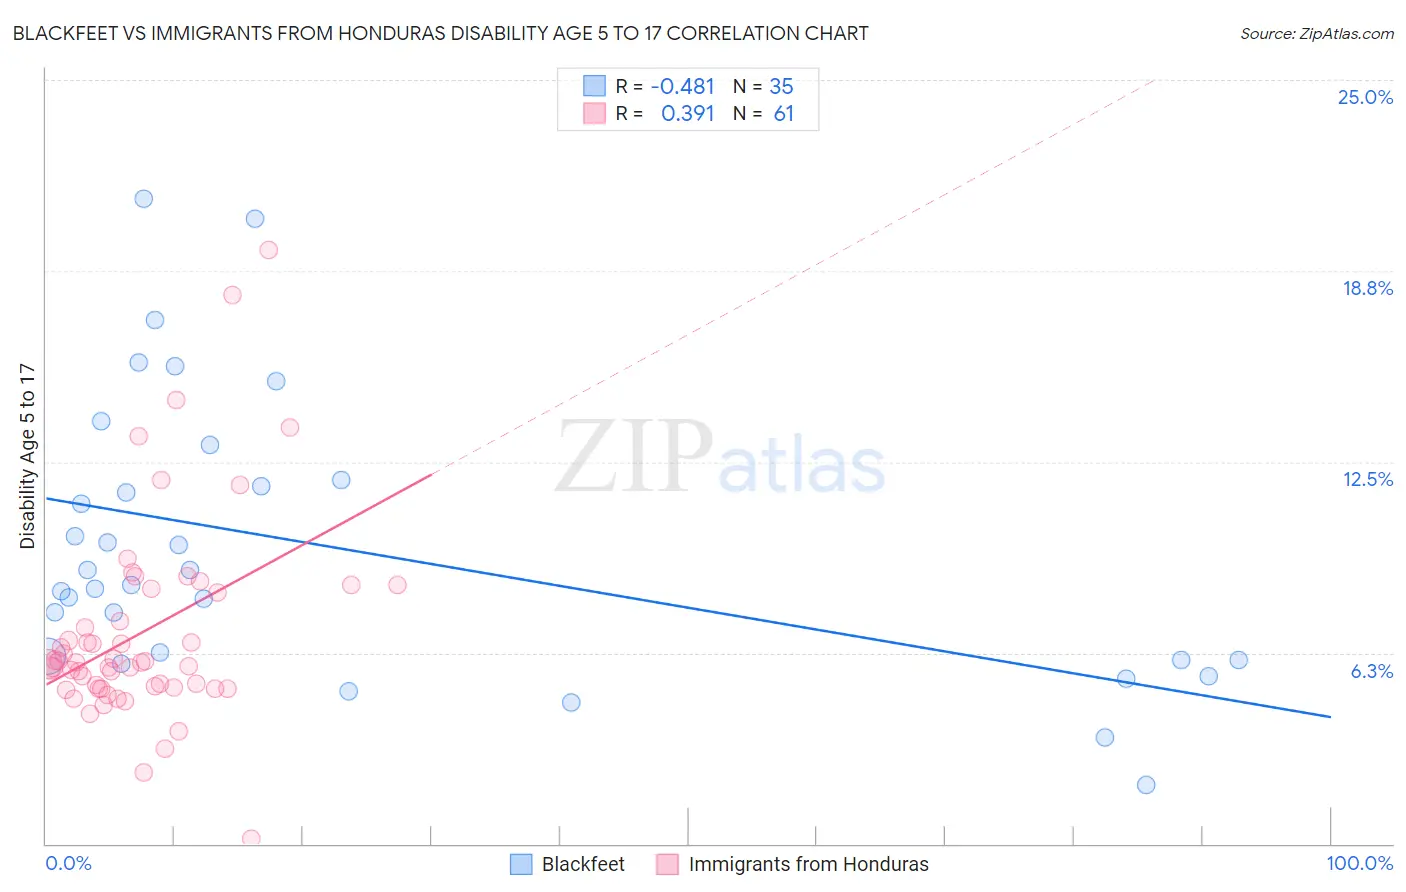
Blackfeet vs Immigrants from Honduras Disability Age 5 to 17 Correlation Chart
The statistical analysis conducted on geographies consisting of 307,715,312 people shows a moderate negative correlation between the proportion of Blackfeet and percentage of population with a disability between the ages 5 and 17 in the United States with a correlation coefficient (R) of -0.481 and weighted average of 6.6%. Similarly, the statistical analysis conducted on geographies consisting of 321,075,572 people shows a mild positive correlation between the proportion of Immigrants from Honduras and percentage of population with a disability between the ages 5 and 17 in the United States with a correlation coefficient (R) of 0.391 and weighted average of 5.9%, a difference of 12.2%.
Disability Age 5 to 17 Correlation Summary
| Measurement | Blackfeet | Immigrants from Honduras |
| Minimum | 1.9% | 0.17% |
| Maximum | 21.1% | 19.4% |
| Range | 19.2% | 19.3% |
| Mean | 9.7% | 6.9% |
| Median | 8.5% | 5.9% |
| Interquartile 25% (IQ1) | 6.0% | 5.1% |
| Interquartile 75% (IQ3) | 11.9% | 8.3% |
| Interquartile Range (IQR) | 5.9% | 3.2% |
| Standard Deviation (Sample) | 4.6% | 3.4% |
| Standard Deviation (Population) | 4.5% | 3.3% |
Similar Demographics by Disability Age 5 to 17
Demographics Similar to Blackfeet by Disability Age 5 to 17
In terms of disability age 5 to 17, the demographic groups most similar to Blackfeet are Pennsylvania German (6.6%, a difference of 0.17%), French American Indian (6.6%, a difference of 0.40%), Potawatomi (6.5%, a difference of 0.84%), American (6.5%, a difference of 0.97%), and Dominican (6.5%, a difference of 1.0%).
| Demographics | Rating | Rank | Disability Age 5 to 17 |
| Slovaks | 0.0 /100 | #322 | Tragic 6.5% |
| Osage | 0.0 /100 | #323 | Tragic 6.5% |
| Dominicans | 0.0 /100 | #324 | Tragic 6.5% |
| Americans | 0.0 /100 | #325 | Tragic 6.5% |
| Potawatomi | 0.0 /100 | #326 | Tragic 6.5% |
| French American Indians | 0.0 /100 | #327 | Tragic 6.6% |
| Pennsylvania Germans | 0.0 /100 | #328 | Tragic 6.6% |
| Blackfeet | 0.0 /100 | #329 | Tragic 6.6% |
| Dutch West Indians | 0.0 /100 | #330 | Tragic 6.7% |
| French Canadians | 0.0 /100 | #331 | Tragic 6.7% |
| Immigrants | Azores | 0.0 /100 | #332 | Tragic 6.7% |
| Blacks/African Americans | 0.0 /100 | #333 | Tragic 6.8% |
| Seminole | 0.0 /100 | #334 | Tragic 6.8% |
| Ottawa | 0.0 /100 | #335 | Tragic 6.8% |
| Chickasaw | 0.0 /100 | #336 | Tragic 6.8% |
Demographics Similar to Immigrants from Honduras by Disability Age 5 to 17
In terms of disability age 5 to 17, the demographic groups most similar to Immigrants from Honduras are Immigrants from Germany (5.9%, a difference of 0.030%), Immigrants from Micronesia (5.9%, a difference of 0.030%), Tlingit-Haida (5.9%, a difference of 0.030%), British (5.9%, a difference of 0.070%), and Indonesian (5.9%, a difference of 0.090%).
| Demographics | Rating | Rank | Disability Age 5 to 17 |
| West Indians | 2.4 /100 | #240 | Tragic 5.9% |
| Immigrants | Caribbean | 2.1 /100 | #241 | Tragic 5.9% |
| Spaniards | 2.0 /100 | #242 | Tragic 5.9% |
| Indonesians | 2.0 /100 | #243 | Tragic 5.9% |
| Immigrants | Germany | 1.9 /100 | #244 | Tragic 5.9% |
| Immigrants | Micronesia | 1.9 /100 | #245 | Tragic 5.9% |
| Tlingit-Haida | 1.9 /100 | #246 | Tragic 5.9% |
| Immigrants | Honduras | 1.8 /100 | #247 | Tragic 5.9% |
| British | 1.7 /100 | #248 | Tragic 5.9% |
| Immigrants | Ghana | 1.7 /100 | #249 | Tragic 5.9% |
| Poles | 1.5 /100 | #250 | Tragic 5.9% |
| Immigrants | Cambodia | 1.5 /100 | #251 | Tragic 5.9% |
| Hondurans | 1.5 /100 | #252 | Tragic 5.9% |
| Scandinavians | 1.4 /100 | #253 | Tragic 5.9% |
| Barbadians | 1.3 /100 | #254 | Tragic 5.9% |