Greek vs Immigrants from Honduras College, Under 1 year
COMPARE
Greek
Immigrants from Honduras
College, Under 1 year
College, Under 1 year Comparison
Greeks
Immigrants from Honduras
68.5%
COLLEGE, UNDER 1 YEAR
98.6/ 100
METRIC RATING
79th/ 347
METRIC RANK
56.5%
COLLEGE, UNDER 1 YEAR
0.0/ 100
METRIC RATING
323rd/ 347
METRIC RANK
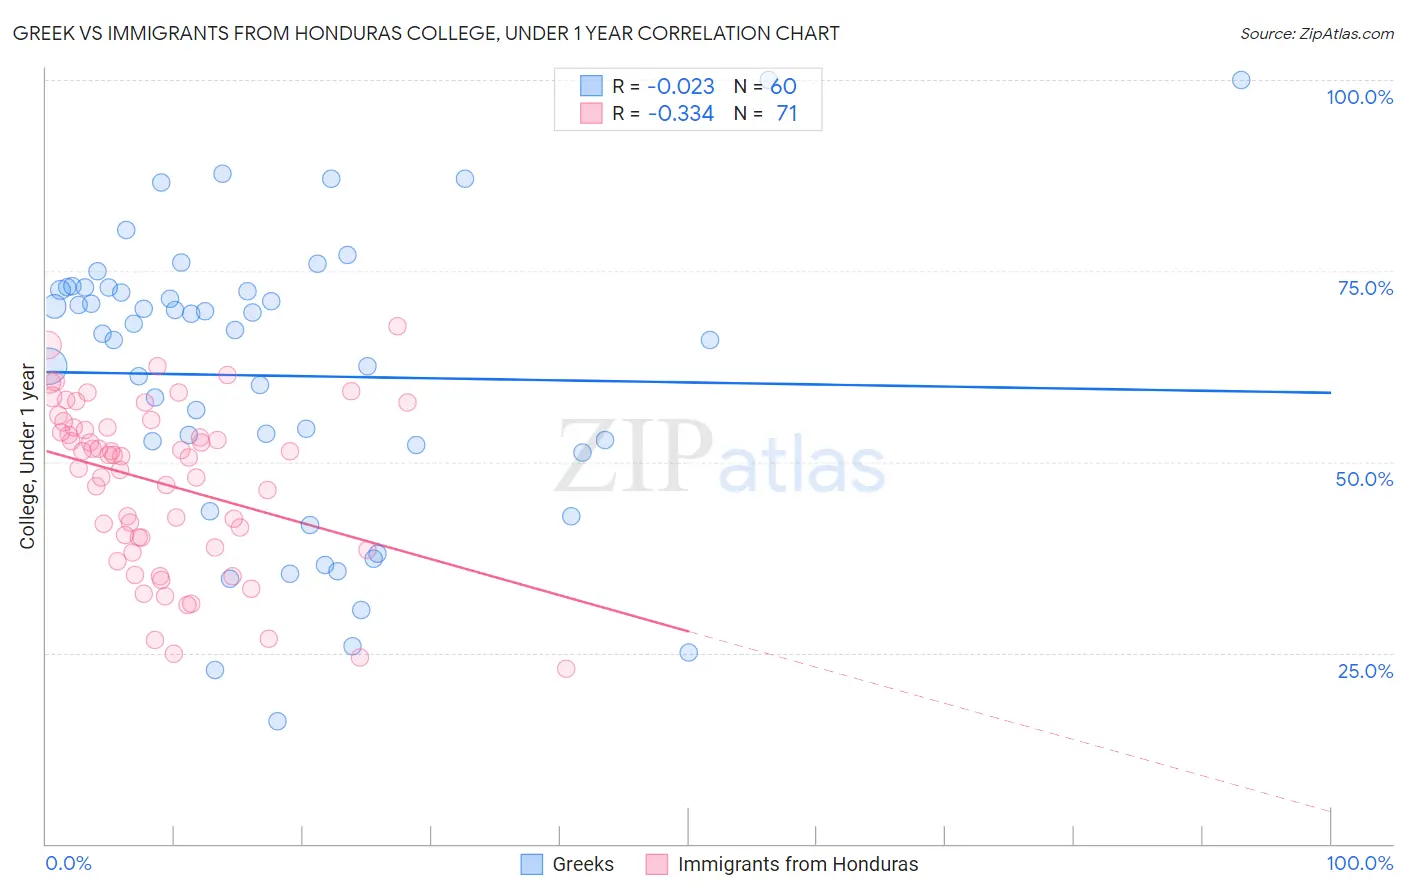
Greek vs Immigrants from Honduras College, Under 1 year Correlation Chart
The statistical analysis conducted on geographies consisting of 482,772,092 people shows no correlation between the proportion of Greeks and percentage of population with at least college, under 1 year education in the United States with a correlation coefficient (R) of -0.023 and weighted average of 68.5%. Similarly, the statistical analysis conducted on geographies consisting of 322,637,196 people shows a mild negative correlation between the proportion of Immigrants from Honduras and percentage of population with at least college, under 1 year education in the United States with a correlation coefficient (R) of -0.334 and weighted average of 56.5%, a difference of 21.2%.
College, Under 1 year Correlation Summary
| Measurement | Greek | Immigrants from Honduras |
| Minimum | 16.1% | 22.9% |
| Maximum | 100.0% | 67.7% |
| Range | 83.9% | 44.7% |
| Mean | 61.3% | 47.1% |
| Median | 67.1% | 50.8% |
| Interquartile 25% (IQ1) | 51.7% | 38.7% |
| Interquartile 75% (IQ3) | 72.6% | 54.5% |
| Interquartile Range (IQR) | 21.0% | 15.8% |
| Standard Deviation (Sample) | 18.9% | 10.8% |
| Standard Deviation (Population) | 18.8% | 10.7% |
Similar Demographics by College, Under 1 year
Demographics Similar to Greeks by College, Under 1 year
In terms of college, under 1 year, the demographic groups most similar to Greeks are Danish (68.5%, a difference of 0.010%), British (68.5%, a difference of 0.020%), Immigrants from Spain (68.4%, a difference of 0.030%), Immigrants from Western Europe (68.5%, a difference of 0.070%), and Laotian (68.5%, a difference of 0.070%).
| Demographics | Rating | Rank | College, Under 1 year |
| Bolivians | 99.0 /100 | #72 | Exceptional 68.7% |
| Immigrants | England | 99.0 /100 | #73 | Exceptional 68.7% |
| Swedes | 98.9 /100 | #74 | Exceptional 68.7% |
| Immigrants | Western Europe | 98.6 /100 | #75 | Exceptional 68.5% |
| Laotians | 98.6 /100 | #76 | Exceptional 68.5% |
| British | 98.6 /100 | #77 | Exceptional 68.5% |
| Danes | 98.6 /100 | #78 | Exceptional 68.5% |
| Greeks | 98.6 /100 | #79 | Exceptional 68.5% |
| Immigrants | Spain | 98.5 /100 | #80 | Exceptional 68.4% |
| Immigrants | Greece | 98.5 /100 | #81 | Exceptional 68.4% |
| Norwegians | 98.4 /100 | #82 | Exceptional 68.4% |
| Argentineans | 98.4 /100 | #83 | Exceptional 68.4% |
| Immigrants | Hungary | 98.3 /100 | #84 | Exceptional 68.3% |
| Egyptians | 98.3 /100 | #85 | Exceptional 68.3% |
| Immigrants | Lebanon | 98.3 /100 | #86 | Exceptional 68.3% |
Demographics Similar to Immigrants from Honduras by College, Under 1 year
In terms of college, under 1 year, the demographic groups most similar to Immigrants from Honduras are Immigrants from El Salvador (56.4%, a difference of 0.13%), Immigrants from Caribbean (56.6%, a difference of 0.18%), Immigrants from Latin America (56.3%, a difference of 0.23%), Native/Alaskan (56.6%, a difference of 0.31%), and Navajo (56.3%, a difference of 0.38%).
| Demographics | Rating | Rank | College, Under 1 year |
| Menominee | 0.0 /100 | #316 | Tragic 57.0% |
| Hispanics or Latinos | 0.0 /100 | #317 | Tragic 57.0% |
| Immigrants | Haiti | 0.0 /100 | #318 | Tragic 56.9% |
| Puerto Ricans | 0.0 /100 | #319 | Tragic 56.8% |
| Guatemalans | 0.0 /100 | #320 | Tragic 56.8% |
| Natives/Alaskans | 0.0 /100 | #321 | Tragic 56.6% |
| Immigrants | Caribbean | 0.0 /100 | #322 | Tragic 56.6% |
| Immigrants | Honduras | 0.0 /100 | #323 | Tragic 56.5% |
| Immigrants | El Salvador | 0.0 /100 | #324 | Tragic 56.4% |
| Immigrants | Latin America | 0.0 /100 | #325 | Tragic 56.3% |
| Navajo | 0.0 /100 | #326 | Tragic 56.3% |
| Immigrants | Guatemala | 0.0 /100 | #327 | Tragic 56.2% |
| Cape Verdeans | 0.0 /100 | #328 | Tragic 56.0% |
| Immigrants | Cuba | 0.0 /100 | #329 | Tragic 55.7% |
| Mexicans | 0.0 /100 | #330 | Tragic 55.6% |