Immigrants from Uganda vs Australian Disability Age 5 to 17
COMPARE
Immigrants from Uganda
Australian
Disability Age 5 to 17
Disability Age 5 to 17 Comparison
Immigrants from Uganda
Australians
5.8%
DISABILITY AGE 5 TO 17
9.7/ 100
METRIC RATING
209th/ 347
METRIC RANK
5.5%
DISABILITY AGE 5 TO 17
78.8/ 100
METRIC RATING
154th/ 347
METRIC RANK
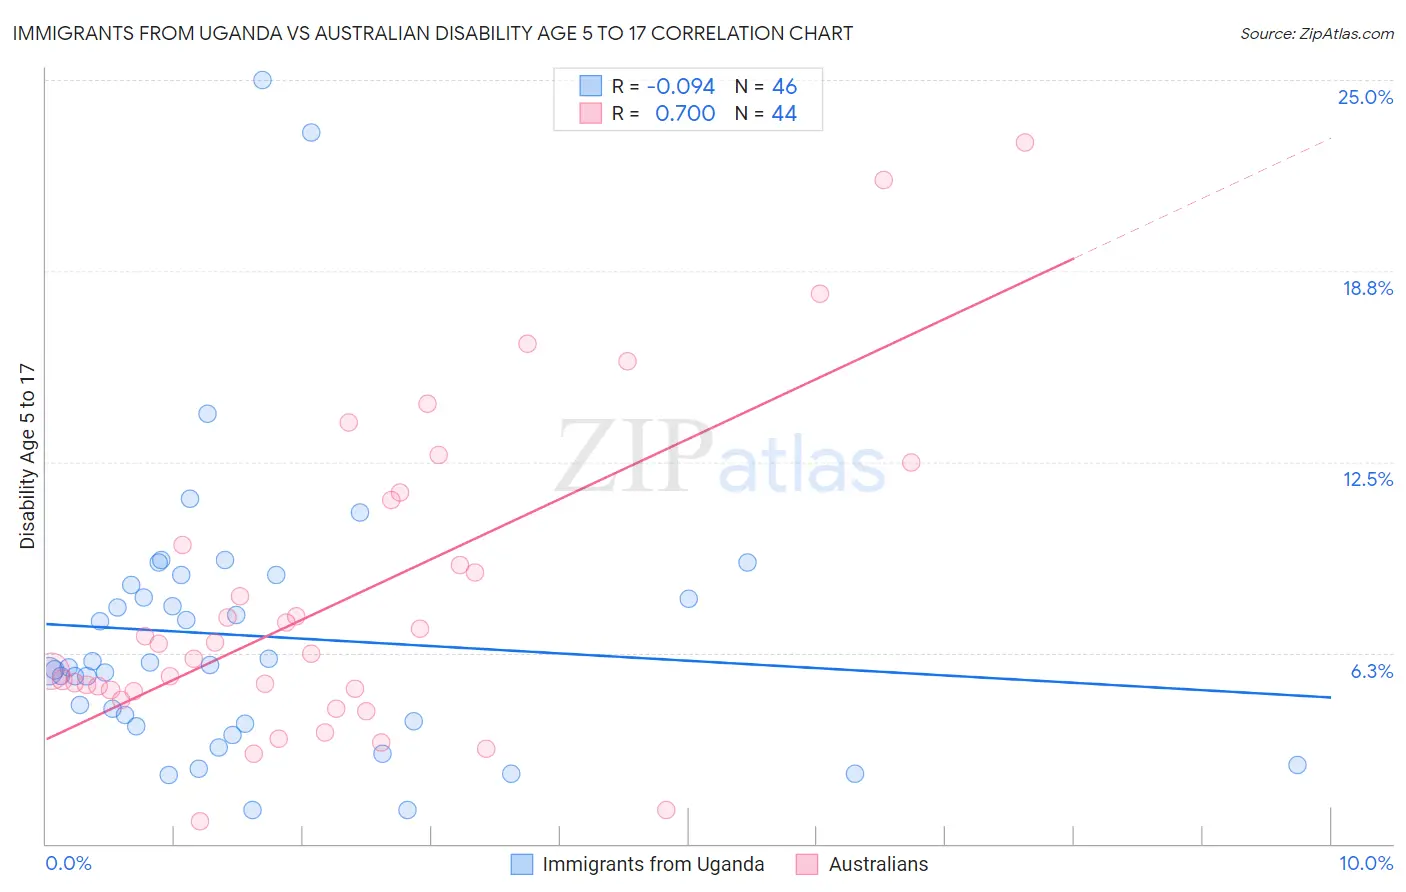
Immigrants from Uganda vs Australian Disability Age 5 to 17 Correlation Chart
The statistical analysis conducted on geographies consisting of 125,737,138 people shows a slight negative correlation between the proportion of Immigrants from Uganda and percentage of population with a disability between the ages 5 and 17 in the United States with a correlation coefficient (R) of -0.094 and weighted average of 5.8%. Similarly, the statistical analysis conducted on geographies consisting of 222,865,567 people shows a strong positive correlation between the proportion of Australians and percentage of population with a disability between the ages 5 and 17 in the United States with a correlation coefficient (R) of 0.700 and weighted average of 5.5%, a difference of 4.4%.
Disability Age 5 to 17 Correlation Summary
| Measurement | Immigrants from Uganda | Australian |
| Minimum | 1.1% | 0.74% |
| Maximum | 25.0% | 23.0% |
| Range | 23.9% | 22.2% |
| Mean | 6.8% | 8.0% |
| Median | 5.8% | 6.4% |
| Interquartile 25% (IQ1) | 3.9% | 5.0% |
| Interquartile 75% (IQ3) | 8.5% | 10.5% |
| Interquartile Range (IQR) | 4.5% | 5.5% |
| Standard Deviation (Sample) | 4.7% | 5.1% |
| Standard Deviation (Population) | 4.6% | 5.1% |
Similar Demographics by Disability Age 5 to 17
Demographics Similar to Immigrants from Uganda by Disability Age 5 to 17
In terms of disability age 5 to 17, the demographic groups most similar to Immigrants from Uganda are Immigrants from Haiti (5.8%, a difference of 0.030%), Kenyan (5.8%, a difference of 0.040%), Yugoslavian (5.8%, a difference of 0.080%), Moroccan (5.7%, a difference of 0.090%), and Trinidadian and Tobagonian (5.7%, a difference of 0.14%).
| Demographics | Rating | Rank | Disability Age 5 to 17 |
| Austrians | 13.2 /100 | #202 | Poor 5.7% |
| Spanish American Indians | 12.8 /100 | #203 | Poor 5.7% |
| Paiute | 11.2 /100 | #204 | Poor 5.7% |
| Trinidadians and Tobagonians | 10.8 /100 | #205 | Poor 5.7% |
| Immigrants | Africa | 10.8 /100 | #206 | Poor 5.7% |
| Moroccans | 10.4 /100 | #207 | Poor 5.7% |
| Kenyans | 10.0 /100 | #208 | Poor 5.8% |
| Immigrants | Uganda | 9.7 /100 | #209 | Tragic 5.8% |
| Immigrants | Haiti | 9.5 /100 | #210 | Tragic 5.8% |
| Yugoslavians | 9.1 /100 | #211 | Tragic 5.8% |
| Immigrants | Panama | 8.7 /100 | #212 | Tragic 5.8% |
| Immigrants | Cameroon | 8.3 /100 | #213 | Tragic 5.8% |
| Immigrants | Morocco | 8.3 /100 | #214 | Tragic 5.8% |
| Swedes | 8.1 /100 | #215 | Tragic 5.8% |
| Nigerians | 7.5 /100 | #216 | Tragic 5.8% |
Demographics Similar to Australians by Disability Age 5 to 17
In terms of disability age 5 to 17, the demographic groups most similar to Australians are Immigrants from Ecuador (5.5%, a difference of 0.040%), Hawaiian (5.5%, a difference of 0.060%), Ecuadorian (5.5%, a difference of 0.070%), Immigrants from Costa Rica (5.5%, a difference of 0.070%), and Immigrants from Nepal (5.5%, a difference of 0.12%).
| Demographics | Rating | Rank | Disability Age 5 to 17 |
| Immigrants | Albania | 83.1 /100 | #147 | Excellent 5.5% |
| Samoans | 81.9 /100 | #148 | Excellent 5.5% |
| Central Americans | 81.6 /100 | #149 | Excellent 5.5% |
| Guatemalans | 81.5 /100 | #150 | Excellent 5.5% |
| Estonians | 80.8 /100 | #151 | Excellent 5.5% |
| Ute | 80.6 /100 | #152 | Excellent 5.5% |
| Ecuadorians | 79.7 /100 | #153 | Good 5.5% |
| Australians | 78.8 /100 | #154 | Good 5.5% |
| Immigrants | Ecuador | 78.3 /100 | #155 | Good 5.5% |
| Hawaiians | 78.0 /100 | #156 | Good 5.5% |
| Immigrants | Costa Rica | 77.9 /100 | #157 | Good 5.5% |
| Immigrants | Nepal | 77.1 /100 | #158 | Good 5.5% |
| Immigrants | Zimbabwe | 75.3 /100 | #159 | Good 5.5% |
| South Africans | 73.3 /100 | #160 | Good 5.5% |
| Immigrants | Saudi Arabia | 69.1 /100 | #161 | Good 5.5% |