Chippewa vs Australian Disability Age 5 to 17
COMPARE
Chippewa
Australian
Disability Age 5 to 17
Disability Age 5 to 17 Comparison
Chippewa
Australians
7.1%
DISABILITY AGE 5 TO 17
0.0/ 100
METRIC RATING
342nd/ 347
METRIC RANK
5.5%
DISABILITY AGE 5 TO 17
78.8/ 100
METRIC RATING
154th/ 347
METRIC RANK
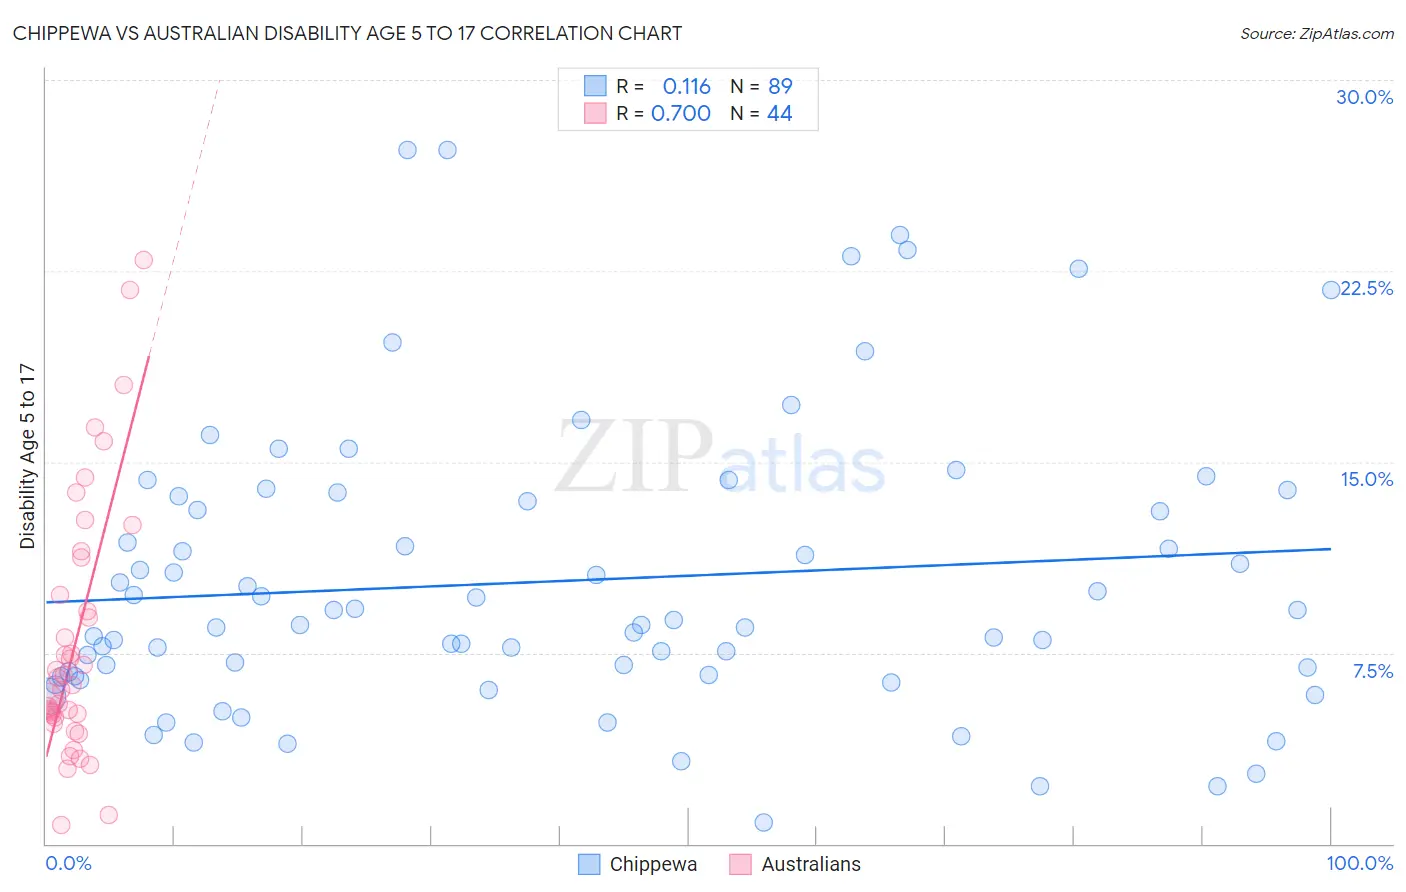
Chippewa vs Australian Disability Age 5 to 17 Correlation Chart
The statistical analysis conducted on geographies consisting of 213,779,900 people shows a poor positive correlation between the proportion of Chippewa and percentage of population with a disability between the ages 5 and 17 in the United States with a correlation coefficient (R) of 0.116 and weighted average of 7.1%. Similarly, the statistical analysis conducted on geographies consisting of 222,865,567 people shows a strong positive correlation between the proportion of Australians and percentage of population with a disability between the ages 5 and 17 in the United States with a correlation coefficient (R) of 0.700 and weighted average of 5.5%, a difference of 29.2%.
Disability Age 5 to 17 Correlation Summary
| Measurement | Chippewa | Australian |
| Minimum | 0.82% | 0.74% |
| Maximum | 27.3% | 23.0% |
| Range | 26.5% | 22.2% |
| Mean | 10.3% | 8.0% |
| Median | 8.6% | 6.4% |
| Interquartile 25% (IQ1) | 6.6% | 5.0% |
| Interquartile 75% (IQ3) | 13.5% | 10.5% |
| Interquartile Range (IQR) | 6.9% | 5.5% |
| Standard Deviation (Sample) | 5.7% | 5.1% |
| Standard Deviation (Population) | 5.6% | 5.1% |
Similar Demographics by Disability Age 5 to 17
Demographics Similar to Chippewa by Disability Age 5 to 17
In terms of disability age 5 to 17, the demographic groups most similar to Chippewa are Immigrants from Cabo Verde (7.1%, a difference of 0.26%), Cajun (7.2%, a difference of 0.96%), Cape Verdean (7.0%, a difference of 2.2%), Cherokee (6.9%, a difference of 2.7%), and Choctaw (6.9%, a difference of 3.0%).
| Demographics | Rating | Rank | Disability Age 5 to 17 |
| Blacks/African Americans | 0.0 /100 | #333 | Tragic 6.8% |
| Seminole | 0.0 /100 | #334 | Tragic 6.8% |
| Ottawa | 0.0 /100 | #335 | Tragic 6.8% |
| Chickasaw | 0.0 /100 | #336 | Tragic 6.8% |
| Creek | 0.0 /100 | #337 | Tragic 6.9% |
| Iroquois | 0.0 /100 | #338 | Tragic 6.9% |
| Choctaw | 0.0 /100 | #339 | Tragic 6.9% |
| Cherokee | 0.0 /100 | #340 | Tragic 6.9% |
| Cape Verdeans | 0.0 /100 | #341 | Tragic 7.0% |
| Chippewa | 0.0 /100 | #342 | Tragic 7.1% |
| Immigrants | Cabo Verde | 0.0 /100 | #343 | Tragic 7.1% |
| Cajuns | 0.0 /100 | #344 | Tragic 7.2% |
| Tsimshian | 0.0 /100 | #345 | Tragic 7.9% |
| Puerto Ricans | 0.0 /100 | #346 | Tragic 8.3% |
| Houma | 0.0 /100 | #347 | Tragic 9.1% |
Demographics Similar to Australians by Disability Age 5 to 17
In terms of disability age 5 to 17, the demographic groups most similar to Australians are Immigrants from Ecuador (5.5%, a difference of 0.040%), Hawaiian (5.5%, a difference of 0.060%), Ecuadorian (5.5%, a difference of 0.070%), Immigrants from Costa Rica (5.5%, a difference of 0.070%), and Immigrants from Nepal (5.5%, a difference of 0.12%).
| Demographics | Rating | Rank | Disability Age 5 to 17 |
| Immigrants | Albania | 83.1 /100 | #147 | Excellent 5.5% |
| Samoans | 81.9 /100 | #148 | Excellent 5.5% |
| Central Americans | 81.6 /100 | #149 | Excellent 5.5% |
| Guatemalans | 81.5 /100 | #150 | Excellent 5.5% |
| Estonians | 80.8 /100 | #151 | Excellent 5.5% |
| Ute | 80.6 /100 | #152 | Excellent 5.5% |
| Ecuadorians | 79.7 /100 | #153 | Good 5.5% |
| Australians | 78.8 /100 | #154 | Good 5.5% |
| Immigrants | Ecuador | 78.3 /100 | #155 | Good 5.5% |
| Hawaiians | 78.0 /100 | #156 | Good 5.5% |
| Immigrants | Costa Rica | 77.9 /100 | #157 | Good 5.5% |
| Immigrants | Nepal | 77.1 /100 | #158 | Good 5.5% |
| Immigrants | Zimbabwe | 75.3 /100 | #159 | Good 5.5% |
| South Africans | 73.3 /100 | #160 | Good 5.5% |
| Immigrants | Saudi Arabia | 69.1 /100 | #161 | Good 5.5% |