Immigrants from Fiji vs Australian Disability Age 5 to 17
COMPARE
Immigrants from Fiji
Australian
Disability Age 5 to 17
Disability Age 5 to 17 Comparison
Immigrants from Fiji
Australians
5.1%
DISABILITY AGE 5 TO 17
99.9/ 100
METRIC RATING
52nd/ 347
METRIC RANK
5.5%
DISABILITY AGE 5 TO 17
78.8/ 100
METRIC RATING
154th/ 347
METRIC RANK
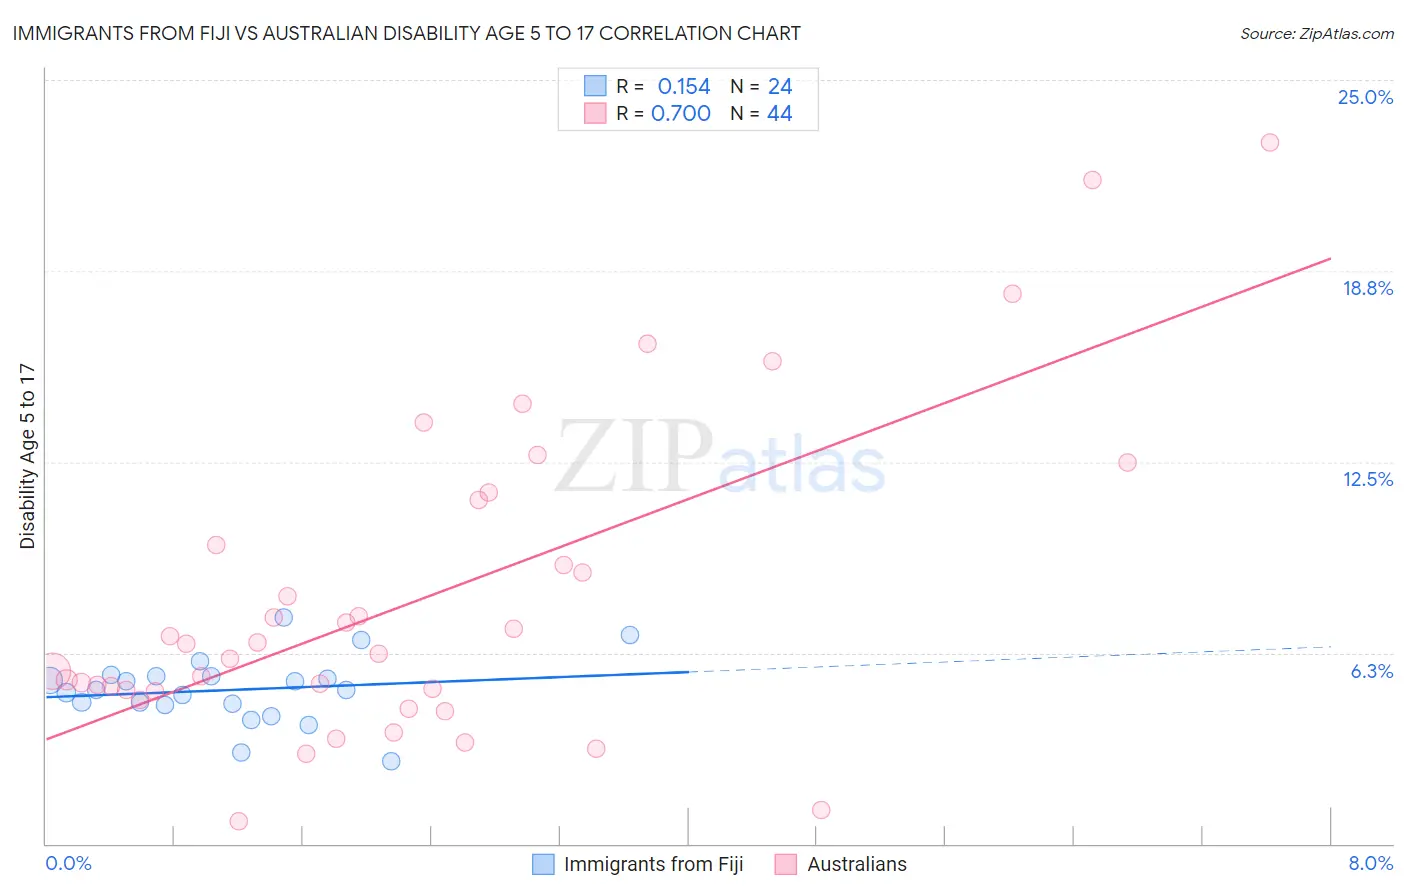
Immigrants from Fiji vs Australian Disability Age 5 to 17 Correlation Chart
The statistical analysis conducted on geographies consisting of 93,508,767 people shows a poor positive correlation between the proportion of Immigrants from Fiji and percentage of population with a disability between the ages 5 and 17 in the United States with a correlation coefficient (R) of 0.154 and weighted average of 5.1%. Similarly, the statistical analysis conducted on geographies consisting of 222,865,567 people shows a strong positive correlation between the proportion of Australians and percentage of population with a disability between the ages 5 and 17 in the United States with a correlation coefficient (R) of 0.700 and weighted average of 5.5%, a difference of 7.9%.
Disability Age 5 to 17 Correlation Summary
| Measurement | Immigrants from Fiji | Australian |
| Minimum | 2.7% | 0.74% |
| Maximum | 7.4% | 23.0% |
| Range | 4.7% | 22.2% |
| Mean | 5.0% | 8.0% |
| Median | 5.0% | 6.4% |
| Interquartile 25% (IQ1) | 4.6% | 5.0% |
| Interquartile 75% (IQ3) | 5.5% | 10.5% |
| Interquartile Range (IQR) | 0.92% | 5.5% |
| Standard Deviation (Sample) | 1.1% | 5.1% |
| Standard Deviation (Population) | 1.1% | 5.1% |
Similar Demographics by Disability Age 5 to 17
Demographics Similar to Immigrants from Fiji by Disability Age 5 to 17
In terms of disability age 5 to 17, the demographic groups most similar to Immigrants from Fiji are Immigrants from Lithuania (5.1%, a difference of 0.050%), Paraguayan (5.1%, a difference of 0.080%), Turkish (5.1%, a difference of 0.090%), Laotian (5.1%, a difference of 0.13%), and Immigrants from Turkey (5.1%, a difference of 0.14%).
| Demographics | Rating | Rank | Disability Age 5 to 17 |
| Tongans | 100.0 /100 | #45 | Exceptional 5.0% |
| Assyrians/Chaldeans/Syriacs | 100.0 /100 | #46 | Exceptional 5.0% |
| Vietnamese | 100.0 /100 | #47 | Exceptional 5.1% |
| Koreans | 100.0 /100 | #48 | Exceptional 5.1% |
| Immigrants | Western Asia | 100.0 /100 | #49 | Exceptional 5.1% |
| Argentineans | 99.9 /100 | #50 | Exceptional 5.1% |
| Turks | 99.9 /100 | #51 | Exceptional 5.1% |
| Immigrants | Fiji | 99.9 /100 | #52 | Exceptional 5.1% |
| Immigrants | Lithuania | 99.9 /100 | #53 | Exceptional 5.1% |
| Paraguayans | 99.9 /100 | #54 | Exceptional 5.1% |
| Laotians | 99.9 /100 | #55 | Exceptional 5.1% |
| Immigrants | Turkey | 99.9 /100 | #56 | Exceptional 5.1% |
| Immigrants | Poland | 99.9 /100 | #57 | Exceptional 5.1% |
| Immigrants | Ukraine | 99.9 /100 | #58 | Exceptional 5.1% |
| Immigrants | North Macedonia | 99.9 /100 | #59 | Exceptional 5.1% |
Demographics Similar to Australians by Disability Age 5 to 17
In terms of disability age 5 to 17, the demographic groups most similar to Australians are Immigrants from Ecuador (5.5%, a difference of 0.040%), Hawaiian (5.5%, a difference of 0.060%), Ecuadorian (5.5%, a difference of 0.070%), Immigrants from Costa Rica (5.5%, a difference of 0.070%), and Immigrants from Nepal (5.5%, a difference of 0.12%).
| Demographics | Rating | Rank | Disability Age 5 to 17 |
| Immigrants | Albania | 83.1 /100 | #147 | Excellent 5.5% |
| Samoans | 81.9 /100 | #148 | Excellent 5.5% |
| Central Americans | 81.6 /100 | #149 | Excellent 5.5% |
| Guatemalans | 81.5 /100 | #150 | Excellent 5.5% |
| Estonians | 80.8 /100 | #151 | Excellent 5.5% |
| Ute | 80.6 /100 | #152 | Excellent 5.5% |
| Ecuadorians | 79.7 /100 | #153 | Good 5.5% |
| Australians | 78.8 /100 | #154 | Good 5.5% |
| Immigrants | Ecuador | 78.3 /100 | #155 | Good 5.5% |
| Hawaiians | 78.0 /100 | #156 | Good 5.5% |
| Immigrants | Costa Rica | 77.9 /100 | #157 | Good 5.5% |
| Immigrants | Nepal | 77.1 /100 | #158 | Good 5.5% |
| Immigrants | Zimbabwe | 75.3 /100 | #159 | Good 5.5% |
| South Africans | 73.3 /100 | #160 | Good 5.5% |
| Immigrants | Saudi Arabia | 69.1 /100 | #161 | Good 5.5% |