Ecuadorian vs Menominee Hearing Disability
COMPARE
Ecuadorian
Menominee
Hearing Disability
Hearing Disability Comparison
Ecuadorians
Menominee
2.5%
HEARING DISABILITY
99.9/ 100
METRIC RATING
14th/ 347
METRIC RANK
3.7%
HEARING DISABILITY
0.0/ 100
METRIC RATING
303rd/ 347
METRIC RANK
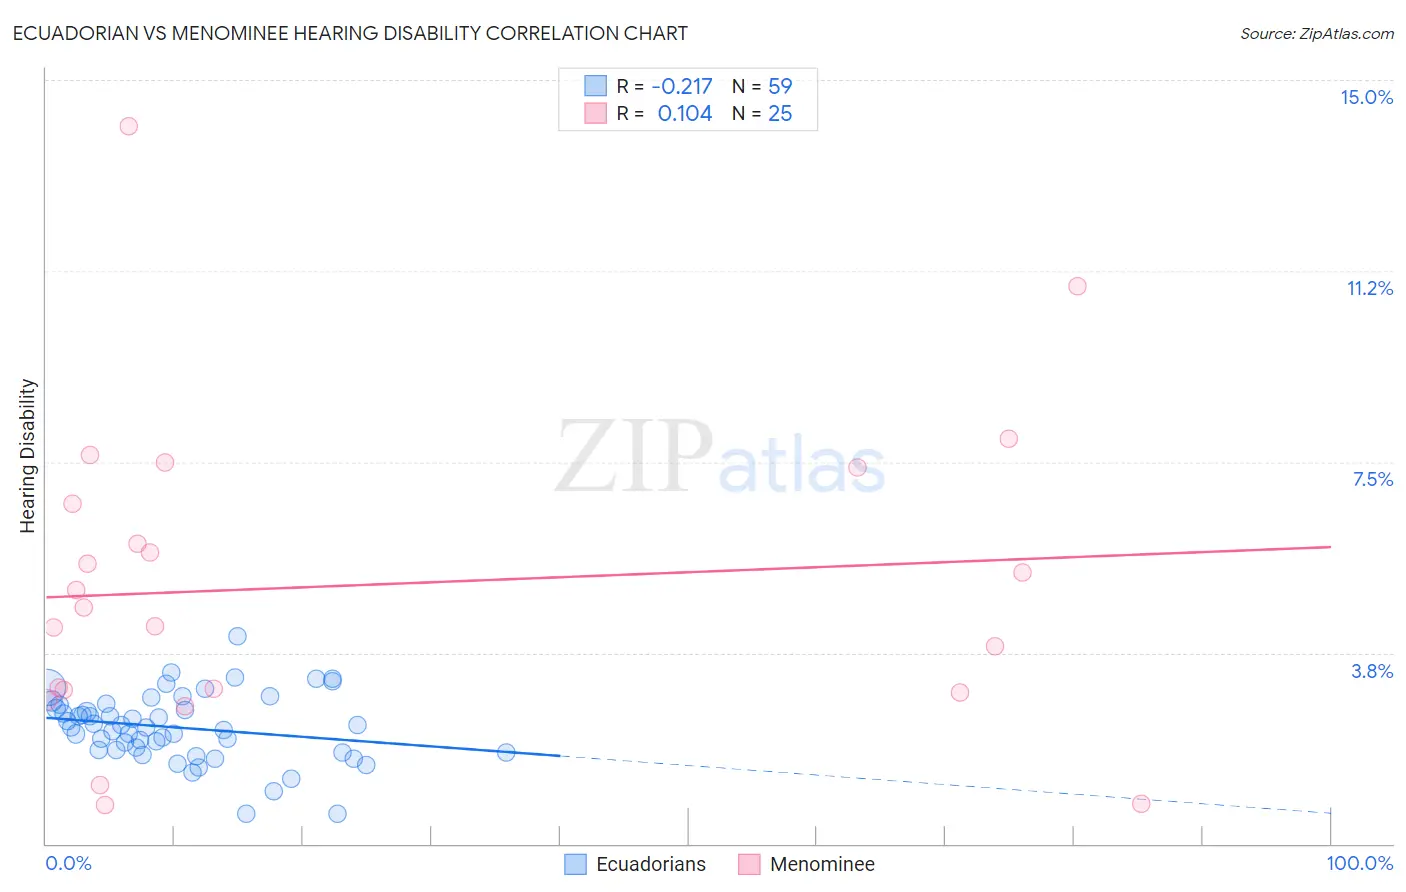
Ecuadorian vs Menominee Hearing Disability Correlation Chart
The statistical analysis conducted on geographies consisting of 317,698,915 people shows a weak negative correlation between the proportion of Ecuadorians and percentage of population with hearing disability in the United States with a correlation coefficient (R) of -0.217 and weighted average of 2.5%. Similarly, the statistical analysis conducted on geographies consisting of 45,777,415 people shows a poor positive correlation between the proportion of Menominee and percentage of population with hearing disability in the United States with a correlation coefficient (R) of 0.104 and weighted average of 3.7%, a difference of 49.1%.
Hearing Disability Correlation Summary
| Measurement | Ecuadorian | Menominee |
| Minimum | 0.58% | 0.77% |
| Maximum | 4.1% | 14.1% |
| Range | 3.5% | 13.3% |
| Mean | 2.3% | 5.1% |
| Median | 2.3% | 4.6% |
| Interquartile 25% (IQ1) | 1.8% | 3.0% |
| Interquartile 75% (IQ3) | 2.7% | 7.0% |
| Interquartile Range (IQR) | 0.90% | 4.0% |
| Standard Deviation (Sample) | 0.67% | 3.1% |
| Standard Deviation (Population) | 0.66% | 3.0% |
Similar Demographics by Hearing Disability
Demographics Similar to Ecuadorians by Hearing Disability
In terms of hearing disability, the demographic groups most similar to Ecuadorians are Barbadian (2.5%, a difference of 0.30%), Sierra Leonean (2.5%, a difference of 0.32%), Immigrants from West Indies (2.5%, a difference of 0.45%), Trinidadian and Tobagonian (2.5%, a difference of 0.54%), and Immigrants from India (2.5%, a difference of 0.77%).
| Demographics | Rating | Rank | Hearing Disability |
| Immigrants | Bangladesh | 100.0 /100 | #7 | Exceptional 2.4% |
| British West Indians | 100.0 /100 | #8 | Exceptional 2.4% |
| Immigrants | Dominican Republic | 100.0 /100 | #9 | Exceptional 2.4% |
| Immigrants | Ecuador | 99.9 /100 | #10 | Exceptional 2.5% |
| Immigrants | Trinidad and Tobago | 99.9 /100 | #11 | Exceptional 2.5% |
| Trinidadians and Tobagonians | 99.9 /100 | #12 | Exceptional 2.5% |
| Sierra Leoneans | 99.9 /100 | #13 | Exceptional 2.5% |
| Ecuadorians | 99.9 /100 | #14 | Exceptional 2.5% |
| Barbadians | 99.9 /100 | #15 | Exceptional 2.5% |
| Immigrants | West Indies | 99.9 /100 | #16 | Exceptional 2.5% |
| Immigrants | India | 99.9 /100 | #17 | Exceptional 2.5% |
| Dominicans | 99.8 /100 | #18 | Exceptional 2.5% |
| Thais | 99.8 /100 | #19 | Exceptional 2.5% |
| Immigrants | Bolivia | 99.8 /100 | #20 | Exceptional 2.5% |
| Ghanaians | 99.8 /100 | #21 | Exceptional 2.5% |
Demographics Similar to Menominee by Hearing Disability
In terms of hearing disability, the demographic groups most similar to Menominee are Dutch (3.7%, a difference of 0.060%), Pennsylvania German (3.7%, a difference of 0.16%), Scottish (3.7%, a difference of 0.19%), German (3.7%, a difference of 0.25%), and French (3.8%, a difference of 0.30%).
| Demographics | Rating | Rank | Hearing Disability |
| Pima | 0.0 /100 | #296 | Tragic 3.7% |
| Immigrants | Azores | 0.0 /100 | #297 | Tragic 3.7% |
| Celtics | 0.0 /100 | #298 | Tragic 3.7% |
| Germans | 0.0 /100 | #299 | Tragic 3.7% |
| Scottish | 0.0 /100 | #300 | Tragic 3.7% |
| Pennsylvania Germans | 0.0 /100 | #301 | Tragic 3.7% |
| Dutch | 0.0 /100 | #302 | Tragic 3.7% |
| Menominee | 0.0 /100 | #303 | Tragic 3.7% |
| French | 0.0 /100 | #304 | Tragic 3.8% |
| English | 0.0 /100 | #305 | Tragic 3.8% |
| Marshallese | 0.0 /100 | #306 | Tragic 3.8% |
| French Canadians | 0.0 /100 | #307 | Tragic 3.8% |
| Ottawa | 0.0 /100 | #308 | Tragic 3.8% |
| Scotch-Irish | 0.0 /100 | #309 | Tragic 3.8% |
| Cree | 0.0 /100 | #310 | Tragic 3.8% |