Ecuadorian vs Sioux Hearing Disability
COMPARE
Ecuadorian
Sioux
Hearing Disability
Hearing Disability Comparison
Ecuadorians
Sioux
2.5%
HEARING DISABILITY
99.9/ 100
METRIC RATING
14th/ 347
METRIC RANK
3.6%
HEARING DISABILITY
0.0/ 100
METRIC RATING
285th/ 347
METRIC RANK
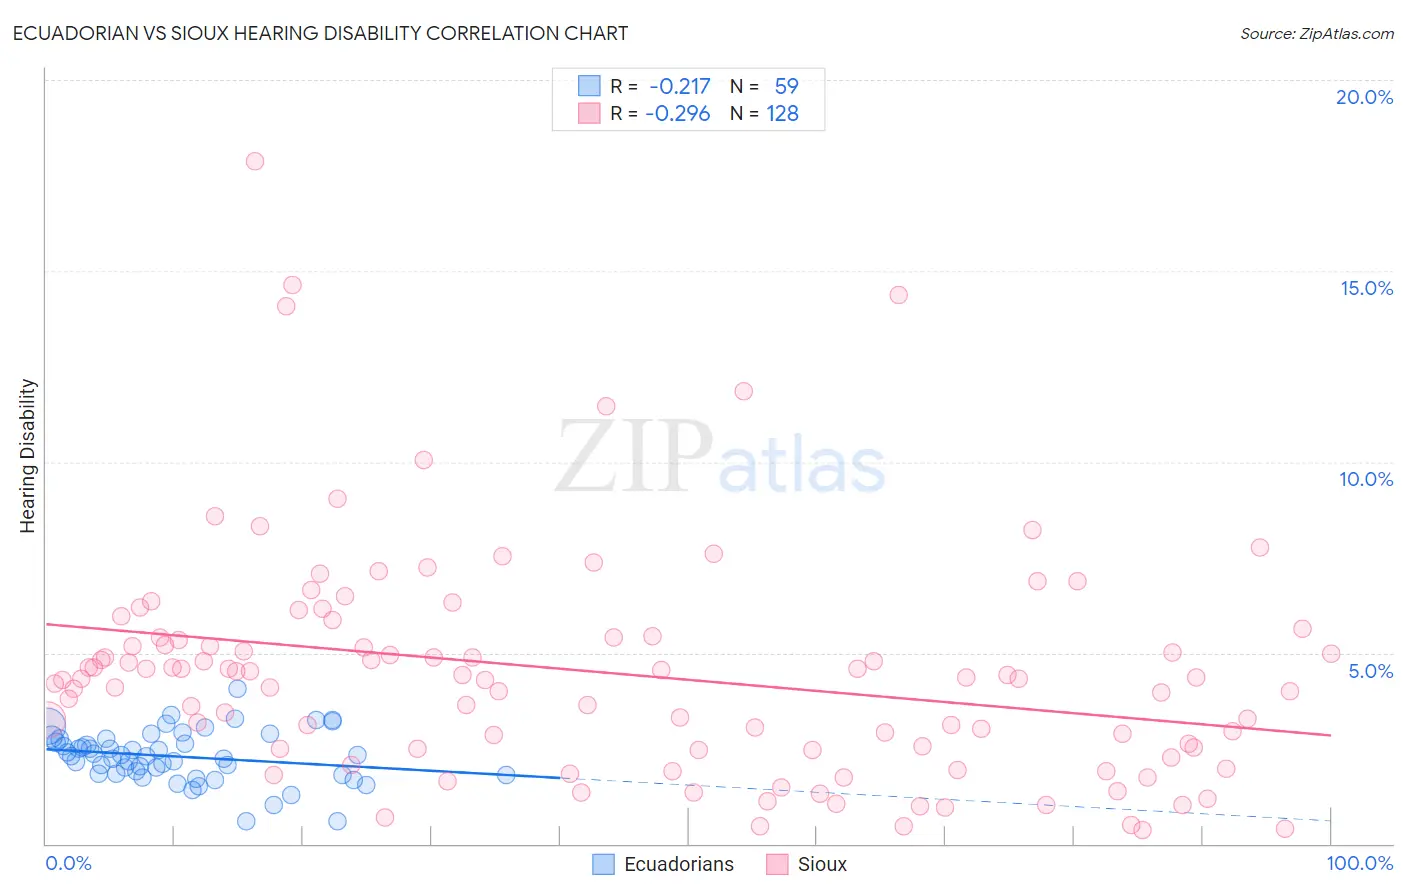
Ecuadorian vs Sioux Hearing Disability Correlation Chart
The statistical analysis conducted on geographies consisting of 317,698,915 people shows a weak negative correlation between the proportion of Ecuadorians and percentage of population with hearing disability in the United States with a correlation coefficient (R) of -0.217 and weighted average of 2.5%. Similarly, the statistical analysis conducted on geographies consisting of 234,128,884 people shows a weak negative correlation between the proportion of Sioux and percentage of population with hearing disability in the United States with a correlation coefficient (R) of -0.296 and weighted average of 3.6%, a difference of 45.1%.
Hearing Disability Correlation Summary
| Measurement | Ecuadorian | Sioux |
| Minimum | 0.58% | 0.37% |
| Maximum | 4.1% | 17.9% |
| Range | 3.5% | 17.5% |
| Mean | 2.3% | 4.5% |
| Median | 2.3% | 4.3% |
| Interquartile 25% (IQ1) | 1.8% | 2.5% |
| Interquartile 75% (IQ3) | 2.7% | 5.4% |
| Interquartile Range (IQR) | 0.90% | 2.9% |
| Standard Deviation (Sample) | 0.67% | 3.0% |
| Standard Deviation (Population) | 0.66% | 3.0% |
Similar Demographics by Hearing Disability
Demographics Similar to Ecuadorians by Hearing Disability
In terms of hearing disability, the demographic groups most similar to Ecuadorians are Barbadian (2.5%, a difference of 0.30%), Sierra Leonean (2.5%, a difference of 0.32%), Immigrants from West Indies (2.5%, a difference of 0.45%), Trinidadian and Tobagonian (2.5%, a difference of 0.54%), and Immigrants from India (2.5%, a difference of 0.77%).
| Demographics | Rating | Rank | Hearing Disability |
| Immigrants | Bangladesh | 100.0 /100 | #7 | Exceptional 2.4% |
| British West Indians | 100.0 /100 | #8 | Exceptional 2.4% |
| Immigrants | Dominican Republic | 100.0 /100 | #9 | Exceptional 2.4% |
| Immigrants | Ecuador | 99.9 /100 | #10 | Exceptional 2.5% |
| Immigrants | Trinidad and Tobago | 99.9 /100 | #11 | Exceptional 2.5% |
| Trinidadians and Tobagonians | 99.9 /100 | #12 | Exceptional 2.5% |
| Sierra Leoneans | 99.9 /100 | #13 | Exceptional 2.5% |
| Ecuadorians | 99.9 /100 | #14 | Exceptional 2.5% |
| Barbadians | 99.9 /100 | #15 | Exceptional 2.5% |
| Immigrants | West Indies | 99.9 /100 | #16 | Exceptional 2.5% |
| Immigrants | India | 99.9 /100 | #17 | Exceptional 2.5% |
| Dominicans | 99.8 /100 | #18 | Exceptional 2.5% |
| Thais | 99.8 /100 | #19 | Exceptional 2.5% |
| Immigrants | Bolivia | 99.8 /100 | #20 | Exceptional 2.5% |
| Ghanaians | 99.8 /100 | #21 | Exceptional 2.5% |
Demographics Similar to Sioux by Hearing Disability
In terms of hearing disability, the demographic groups most similar to Sioux are Delaware (3.6%, a difference of 0.030%), Immigrants from Micronesia (3.6%, a difference of 0.10%), Spanish (3.7%, a difference of 0.28%), Blackfeet (3.6%, a difference of 0.57%), and Swedish (3.6%, a difference of 0.82%).
| Demographics | Rating | Rank | Hearing Disability |
| Basques | 0.0 /100 | #278 | Tragic 3.6% |
| Slovaks | 0.0 /100 | #279 | Tragic 3.6% |
| French American Indians | 0.0 /100 | #280 | Tragic 3.6% |
| Scandinavians | 0.0 /100 | #281 | Tragic 3.6% |
| Swedes | 0.0 /100 | #282 | Tragic 3.6% |
| Blackfeet | 0.0 /100 | #283 | Tragic 3.6% |
| Immigrants | Micronesia | 0.0 /100 | #284 | Tragic 3.6% |
| Sioux | 0.0 /100 | #285 | Tragic 3.6% |
| Delaware | 0.0 /100 | #286 | Tragic 3.6% |
| Spanish | 0.0 /100 | #287 | Tragic 3.7% |
| Irish | 0.0 /100 | #288 | Tragic 3.7% |
| Chinese | 0.0 /100 | #289 | Tragic 3.7% |
| Whites/Caucasians | 0.0 /100 | #290 | Tragic 3.7% |
| Finns | 0.0 /100 | #291 | Tragic 3.7% |
| Native Hawaiians | 0.0 /100 | #292 | Tragic 3.7% |