Lithuanian vs Menominee Hearing Disability
COMPARE
Lithuanian
Menominee
Hearing Disability
Hearing Disability Comparison
Lithuanians
Menominee
3.4%
HEARING DISABILITY
0.6/ 100
METRIC RATING
247th/ 347
METRIC RANK
3.7%
HEARING DISABILITY
0.0/ 100
METRIC RATING
303rd/ 347
METRIC RANK
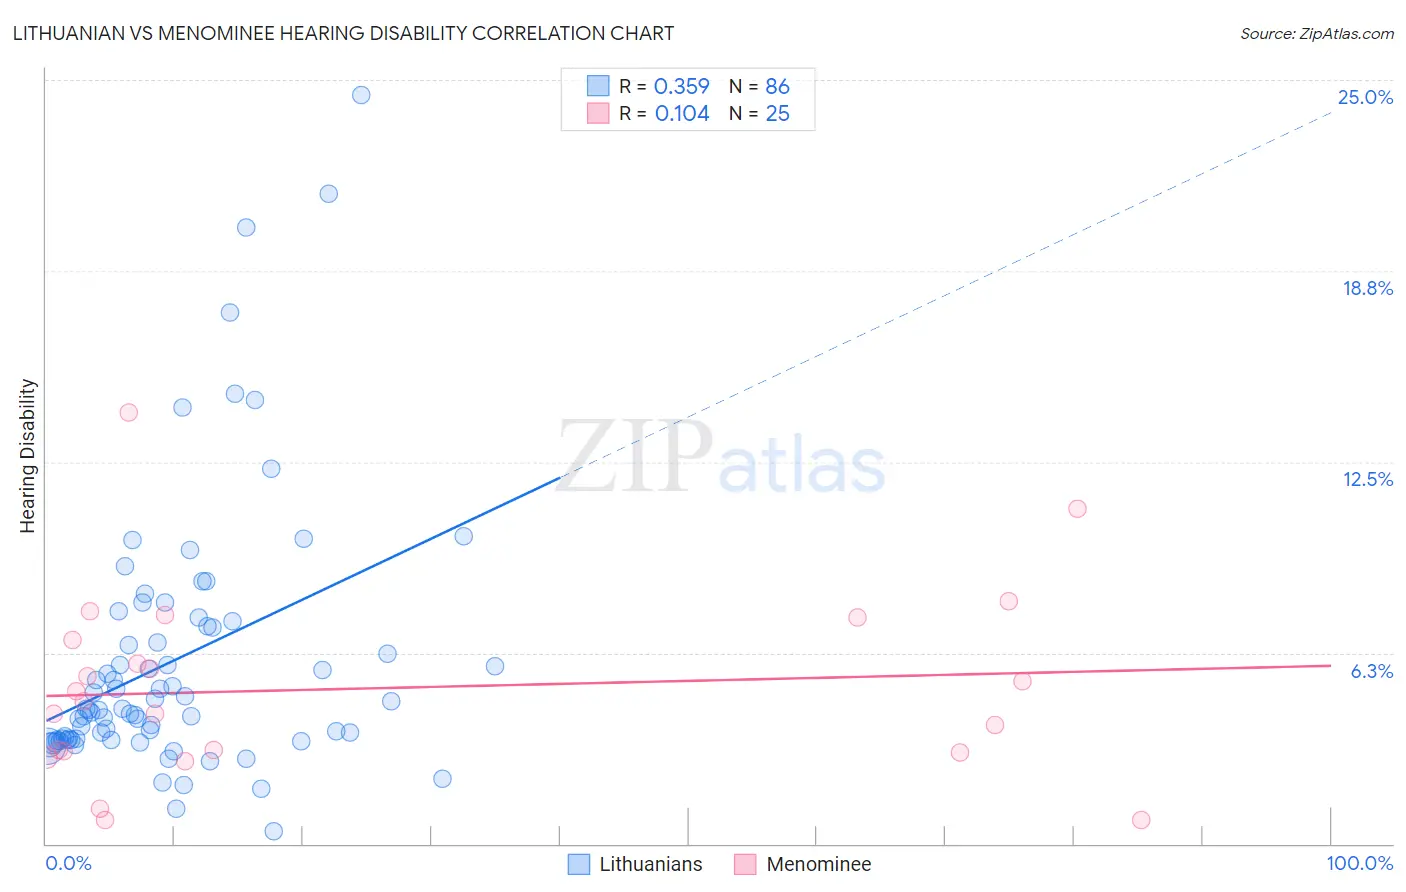
Lithuanian vs Menominee Hearing Disability Correlation Chart
The statistical analysis conducted on geographies consisting of 421,806,281 people shows a mild positive correlation between the proportion of Lithuanians and percentage of population with hearing disability in the United States with a correlation coefficient (R) of 0.359 and weighted average of 3.4%. Similarly, the statistical analysis conducted on geographies consisting of 45,777,415 people shows a poor positive correlation between the proportion of Menominee and percentage of population with hearing disability in the United States with a correlation coefficient (R) of 0.104 and weighted average of 3.7%, a difference of 11.7%.
Hearing Disability Correlation Summary
| Measurement | Lithuanian | Menominee |
| Minimum | 0.40% | 0.77% |
| Maximum | 24.5% | 14.1% |
| Range | 24.1% | 13.3% |
| Mean | 6.0% | 5.1% |
| Median | 4.4% | 4.6% |
| Interquartile 25% (IQ1) | 3.4% | 3.0% |
| Interquartile 75% (IQ3) | 7.1% | 7.0% |
| Interquartile Range (IQR) | 3.7% | 4.0% |
| Standard Deviation (Sample) | 4.4% | 3.1% |
| Standard Deviation (Population) | 4.3% | 3.0% |
Similar Demographics by Hearing Disability
Demographics Similar to Lithuanians by Hearing Disability
In terms of hearing disability, the demographic groups most similar to Lithuanians are Immigrants from England (3.3%, a difference of 0.20%), Austrian (3.4%, a difference of 0.22%), Immigrants from Scotland (3.3%, a difference of 0.48%), Italian (3.4%, a difference of 0.75%), and Yuman (3.4%, a difference of 0.76%).
| Demographics | Rating | Rank | Hearing Disability |
| Immigrants | Netherlands | 1.1 /100 | #240 | Tragic 3.3% |
| Samoans | 1.1 /100 | #241 | Tragic 3.3% |
| Yugoslavians | 1.0 /100 | #242 | Tragic 3.3% |
| Immigrants | Western Europe | 1.0 /100 | #243 | Tragic 3.3% |
| Assyrians/Chaldeans/Syriacs | 0.9 /100 | #244 | Tragic 3.3% |
| Immigrants | Scotland | 0.8 /100 | #245 | Tragic 3.3% |
| Immigrants | England | 0.7 /100 | #246 | Tragic 3.3% |
| Lithuanians | 0.6 /100 | #247 | Tragic 3.4% |
| Austrians | 0.6 /100 | #248 | Tragic 3.4% |
| Italians | 0.4 /100 | #249 | Tragic 3.4% |
| Yuman | 0.4 /100 | #250 | Tragic 3.4% |
| Hungarians | 0.4 /100 | #251 | Tragic 3.4% |
| Croatians | 0.4 /100 | #252 | Tragic 3.4% |
| Carpatho Rusyns | 0.3 /100 | #253 | Tragic 3.4% |
| Slavs | 0.2 /100 | #254 | Tragic 3.4% |
Demographics Similar to Menominee by Hearing Disability
In terms of hearing disability, the demographic groups most similar to Menominee are Dutch (3.7%, a difference of 0.060%), Pennsylvania German (3.7%, a difference of 0.16%), Scottish (3.7%, a difference of 0.19%), German (3.7%, a difference of 0.25%), and French (3.8%, a difference of 0.30%).
| Demographics | Rating | Rank | Hearing Disability |
| Pima | 0.0 /100 | #296 | Tragic 3.7% |
| Immigrants | Azores | 0.0 /100 | #297 | Tragic 3.7% |
| Celtics | 0.0 /100 | #298 | Tragic 3.7% |
| Germans | 0.0 /100 | #299 | Tragic 3.7% |
| Scottish | 0.0 /100 | #300 | Tragic 3.7% |
| Pennsylvania Germans | 0.0 /100 | #301 | Tragic 3.7% |
| Dutch | 0.0 /100 | #302 | Tragic 3.7% |
| Menominee | 0.0 /100 | #303 | Tragic 3.7% |
| French | 0.0 /100 | #304 | Tragic 3.8% |
| English | 0.0 /100 | #305 | Tragic 3.8% |
| Marshallese | 0.0 /100 | #306 | Tragic 3.8% |
| French Canadians | 0.0 /100 | #307 | Tragic 3.8% |
| Ottawa | 0.0 /100 | #308 | Tragic 3.8% |
| Scotch-Irish | 0.0 /100 | #309 | Tragic 3.8% |
| Cree | 0.0 /100 | #310 | Tragic 3.8% |