Immigrants from Latin America vs Menominee Hearing Disability
COMPARE
Immigrants from Latin America
Menominee
Hearing Disability
Hearing Disability Comparison
Immigrants from Latin America
Menominee
2.8%
HEARING DISABILITY
90.5/ 100
METRIC RATING
115th/ 347
METRIC RANK
3.7%
HEARING DISABILITY
0.0/ 100
METRIC RATING
303rd/ 347
METRIC RANK
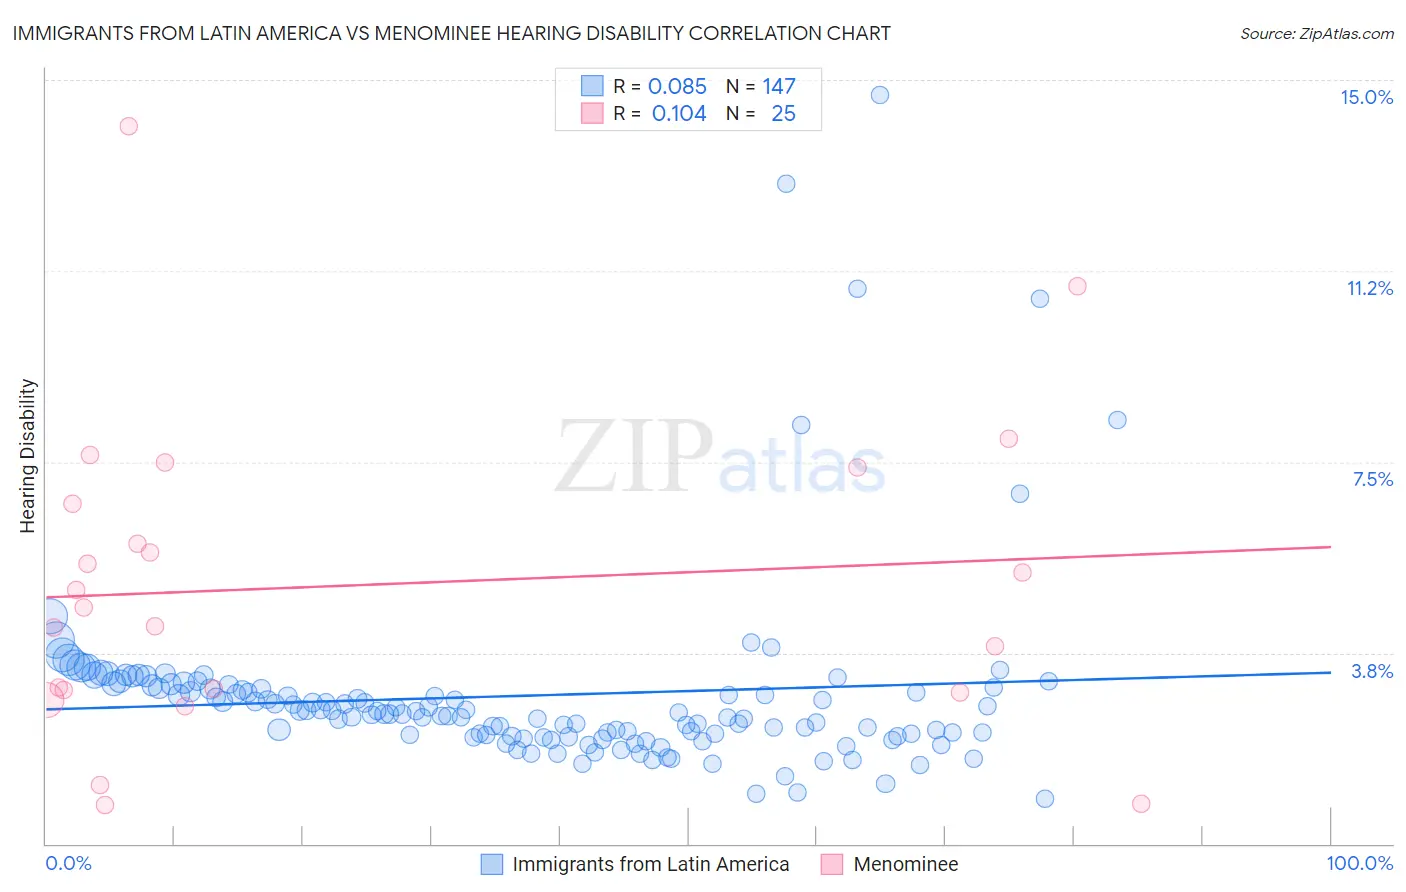
Immigrants from Latin America vs Menominee Hearing Disability Correlation Chart
The statistical analysis conducted on geographies consisting of 557,946,511 people shows a slight positive correlation between the proportion of Immigrants from Latin America and percentage of population with hearing disability in the United States with a correlation coefficient (R) of 0.085 and weighted average of 2.8%. Similarly, the statistical analysis conducted on geographies consisting of 45,777,415 people shows a poor positive correlation between the proportion of Menominee and percentage of population with hearing disability in the United States with a correlation coefficient (R) of 0.104 and weighted average of 3.7%, a difference of 31.9%.
Hearing Disability Correlation Summary
| Measurement | Immigrants from Latin America | Menominee |
| Minimum | 0.89% | 0.77% |
| Maximum | 14.7% | 14.1% |
| Range | 13.8% | 13.3% |
| Mean | 2.9% | 5.1% |
| Median | 2.6% | 4.6% |
| Interquartile 25% (IQ1) | 2.1% | 3.0% |
| Interquartile 75% (IQ3) | 3.0% | 7.0% |
| Interquartile Range (IQR) | 0.94% | 4.0% |
| Standard Deviation (Sample) | 1.9% | 3.1% |
| Standard Deviation (Population) | 1.9% | 3.0% |
Similar Demographics by Hearing Disability
Demographics Similar to Immigrants from Latin America by Hearing Disability
In terms of hearing disability, the demographic groups most similar to Immigrants from Latin America are Immigrants (2.8%, a difference of 0.060%), Immigrants from Liberia (2.8%, a difference of 0.15%), Zimbabwean (2.8%, a difference of 0.16%), Cambodian (2.8%, a difference of 0.17%), and Kenyan (2.8%, a difference of 0.18%).
| Demographics | Rating | Rank | Hearing Disability |
| Guatemalans | 93.2 /100 | #108 | Exceptional 2.8% |
| Turks | 93.0 /100 | #109 | Exceptional 2.8% |
| Cypriots | 92.9 /100 | #110 | Exceptional 2.8% |
| Immigrants | Yemen | 92.7 /100 | #111 | Exceptional 2.8% |
| U.S. Virgin Islanders | 92.5 /100 | #112 | Exceptional 2.8% |
| Immigrants | Belarus | 91.6 /100 | #113 | Exceptional 2.8% |
| Cambodians | 91.1 /100 | #114 | Exceptional 2.8% |
| Immigrants | Latin America | 90.5 /100 | #115 | Exceptional 2.8% |
| Immigrants | Immigrants | 90.3 /100 | #116 | Exceptional 2.8% |
| Immigrants | Liberia | 90.0 /100 | #117 | Excellent 2.8% |
| Zimbabweans | 89.9 /100 | #118 | Excellent 2.8% |
| Kenyans | 89.8 /100 | #119 | Excellent 2.8% |
| Jordanians | 89.5 /100 | #120 | Excellent 2.8% |
| Cubans | 89.4 /100 | #121 | Excellent 2.8% |
| Liberians | 89.0 /100 | #122 | Excellent 2.8% |
Demographics Similar to Menominee by Hearing Disability
In terms of hearing disability, the demographic groups most similar to Menominee are Dutch (3.7%, a difference of 0.060%), Pennsylvania German (3.7%, a difference of 0.16%), Scottish (3.7%, a difference of 0.19%), German (3.7%, a difference of 0.25%), and French (3.8%, a difference of 0.30%).
| Demographics | Rating | Rank | Hearing Disability |
| Pima | 0.0 /100 | #296 | Tragic 3.7% |
| Immigrants | Azores | 0.0 /100 | #297 | Tragic 3.7% |
| Celtics | 0.0 /100 | #298 | Tragic 3.7% |
| Germans | 0.0 /100 | #299 | Tragic 3.7% |
| Scottish | 0.0 /100 | #300 | Tragic 3.7% |
| Pennsylvania Germans | 0.0 /100 | #301 | Tragic 3.7% |
| Dutch | 0.0 /100 | #302 | Tragic 3.7% |
| Menominee | 0.0 /100 | #303 | Tragic 3.7% |
| French | 0.0 /100 | #304 | Tragic 3.8% |
| English | 0.0 /100 | #305 | Tragic 3.8% |
| Marshallese | 0.0 /100 | #306 | Tragic 3.8% |
| French Canadians | 0.0 /100 | #307 | Tragic 3.8% |
| Ottawa | 0.0 /100 | #308 | Tragic 3.8% |
| Scotch-Irish | 0.0 /100 | #309 | Tragic 3.8% |
| Cree | 0.0 /100 | #310 | Tragic 3.8% |