Tohono O'odham vs Menominee Hearing Disability
COMPARE
Tohono O'odham
Menominee
Hearing Disability
Hearing Disability Comparison
Tohono O'odham
Menominee
4.2%
HEARING DISABILITY
0.0/ 100
METRIC RATING
328th/ 347
METRIC RANK
3.7%
HEARING DISABILITY
0.0/ 100
METRIC RATING
303rd/ 347
METRIC RANK
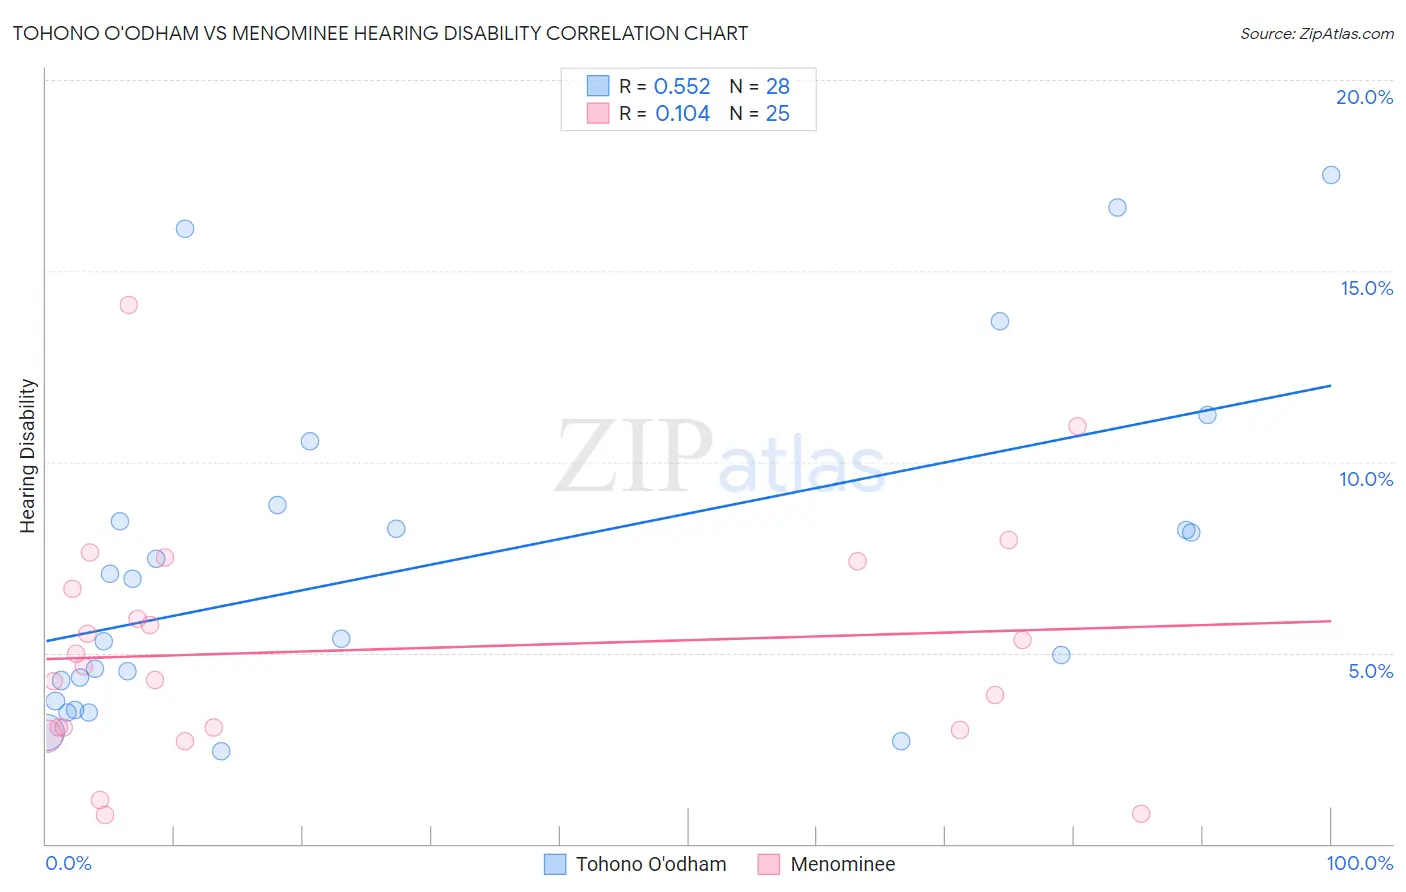
Tohono O'odham vs Menominee Hearing Disability Correlation Chart
The statistical analysis conducted on geographies consisting of 58,715,422 people shows a substantial positive correlation between the proportion of Tohono O'odham and percentage of population with hearing disability in the United States with a correlation coefficient (R) of 0.552 and weighted average of 4.2%. Similarly, the statistical analysis conducted on geographies consisting of 45,777,415 people shows a poor positive correlation between the proportion of Menominee and percentage of population with hearing disability in the United States with a correlation coefficient (R) of 0.104 and weighted average of 3.7%, a difference of 11.3%.
Hearing Disability Correlation Summary
| Measurement | Tohono O'odham | Menominee |
| Minimum | 2.4% | 0.77% |
| Maximum | 17.5% | 14.1% |
| Range | 15.1% | 13.3% |
| Mean | 7.3% | 5.1% |
| Median | 6.1% | 4.6% |
| Interquartile 25% (IQ1) | 4.0% | 3.0% |
| Interquartile 75% (IQ3) | 8.7% | 7.0% |
| Interquartile Range (IQR) | 4.7% | 4.0% |
| Standard Deviation (Sample) | 4.3% | 3.1% |
| Standard Deviation (Population) | 4.3% | 3.0% |
Similar Demographics by Hearing Disability
Demographics Similar to Tohono O'odham by Hearing Disability
In terms of hearing disability, the demographic groups most similar to Tohono O'odham are Crow (4.2%, a difference of 0.010%), Arapaho (4.1%, a difference of 0.38%), Native/Alaskan (4.2%, a difference of 0.80%), Cherokee (4.2%, a difference of 0.95%), and Potawatomi (4.1%, a difference of 1.1%).
| Demographics | Rating | Rank | Hearing Disability |
| Paiute | 0.0 /100 | #321 | Tragic 4.1% |
| Seminole | 0.0 /100 | #322 | Tragic 4.1% |
| Apache | 0.0 /100 | #323 | Tragic 4.1% |
| Osage | 0.0 /100 | #324 | Tragic 4.1% |
| Lumbee | 0.0 /100 | #325 | Tragic 4.1% |
| Potawatomi | 0.0 /100 | #326 | Tragic 4.1% |
| Arapaho | 0.0 /100 | #327 | Tragic 4.1% |
| Tohono O'odham | 0.0 /100 | #328 | Tragic 4.2% |
| Crow | 0.0 /100 | #329 | Tragic 4.2% |
| Natives/Alaskans | 0.0 /100 | #330 | Tragic 4.2% |
| Cherokee | 0.0 /100 | #331 | Tragic 4.2% |
| Houma | 0.0 /100 | #332 | Tragic 4.2% |
| Dutch West Indians | 0.0 /100 | #333 | Tragic 4.3% |
| Aleuts | 0.0 /100 | #334 | Tragic 4.3% |
| Kiowa | 0.0 /100 | #335 | Tragic 4.3% |
Demographics Similar to Menominee by Hearing Disability
In terms of hearing disability, the demographic groups most similar to Menominee are Dutch (3.7%, a difference of 0.060%), Pennsylvania German (3.7%, a difference of 0.16%), Scottish (3.7%, a difference of 0.19%), German (3.7%, a difference of 0.25%), and French (3.8%, a difference of 0.30%).
| Demographics | Rating | Rank | Hearing Disability |
| Pima | 0.0 /100 | #296 | Tragic 3.7% |
| Immigrants | Azores | 0.0 /100 | #297 | Tragic 3.7% |
| Celtics | 0.0 /100 | #298 | Tragic 3.7% |
| Germans | 0.0 /100 | #299 | Tragic 3.7% |
| Scottish | 0.0 /100 | #300 | Tragic 3.7% |
| Pennsylvania Germans | 0.0 /100 | #301 | Tragic 3.7% |
| Dutch | 0.0 /100 | #302 | Tragic 3.7% |
| Menominee | 0.0 /100 | #303 | Tragic 3.7% |
| French | 0.0 /100 | #304 | Tragic 3.8% |
| English | 0.0 /100 | #305 | Tragic 3.8% |
| Marshallese | 0.0 /100 | #306 | Tragic 3.8% |
| French Canadians | 0.0 /100 | #307 | Tragic 3.8% |
| Ottawa | 0.0 /100 | #308 | Tragic 3.8% |
| Scotch-Irish | 0.0 /100 | #309 | Tragic 3.8% |
| Cree | 0.0 /100 | #310 | Tragic 3.8% |