Hawaiian vs Menominee Hearing Disability
COMPARE
Hawaiian
Menominee
Hearing Disability
Hearing Disability Comparison
Hawaiians
Menominee
3.5%
HEARING DISABILITY
0.1/ 100
METRIC RATING
261st/ 347
METRIC RANK
3.7%
HEARING DISABILITY
0.0/ 100
METRIC RATING
303rd/ 347
METRIC RANK
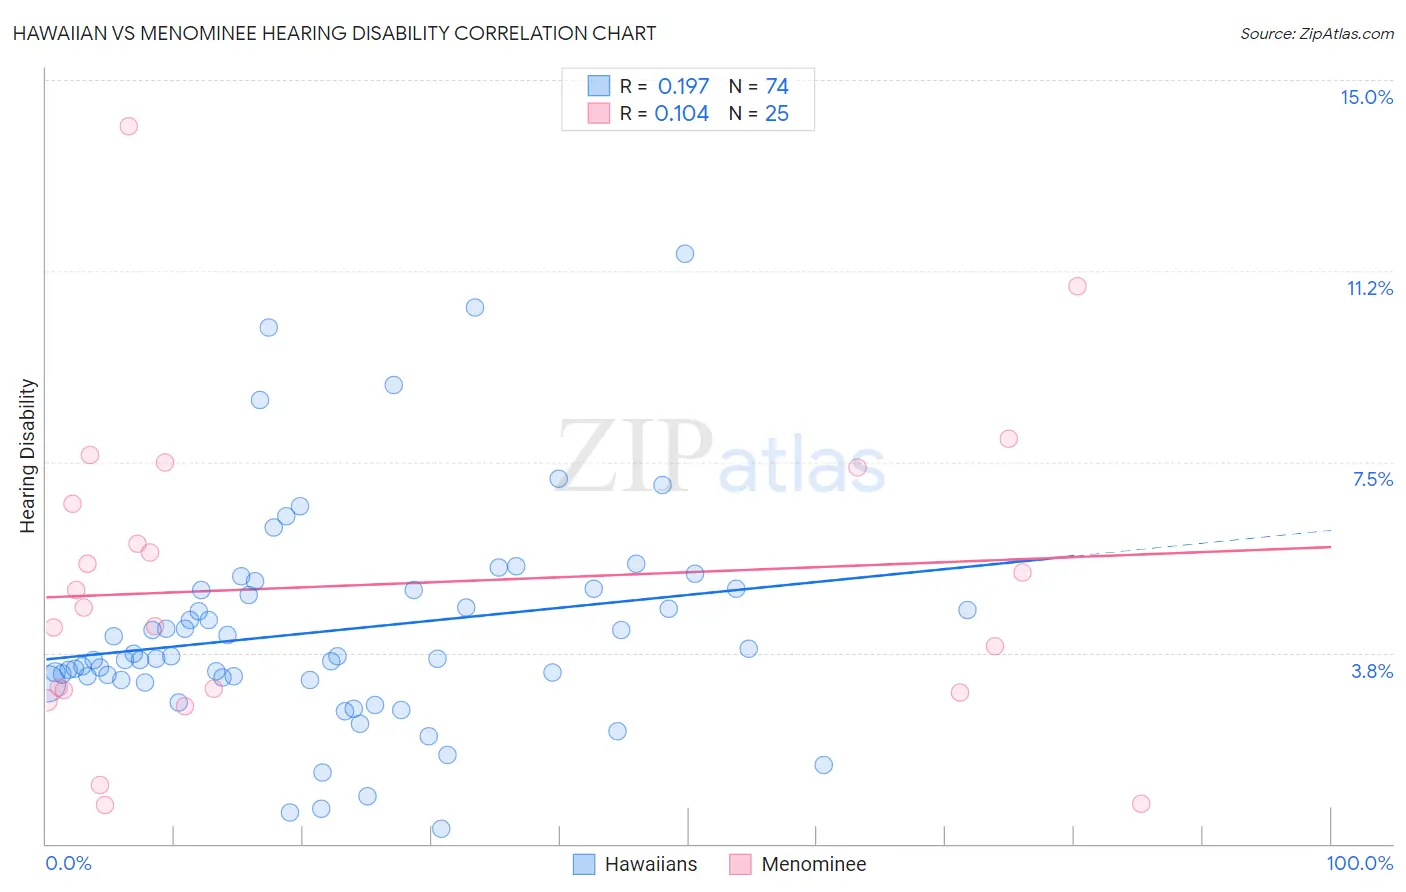
Hawaiian vs Menominee Hearing Disability Correlation Chart
The statistical analysis conducted on geographies consisting of 327,393,622 people shows a poor positive correlation between the proportion of Hawaiians and percentage of population with hearing disability in the United States with a correlation coefficient (R) of 0.197 and weighted average of 3.5%. Similarly, the statistical analysis conducted on geographies consisting of 45,777,415 people shows a poor positive correlation between the proportion of Menominee and percentage of population with hearing disability in the United States with a correlation coefficient (R) of 0.104 and weighted average of 3.7%, a difference of 8.1%.
Hearing Disability Correlation Summary
| Measurement | Hawaiian | Menominee |
| Minimum | 0.29% | 0.77% |
| Maximum | 11.6% | 14.1% |
| Range | 11.3% | 13.3% |
| Mean | 4.2% | 5.1% |
| Median | 3.7% | 4.6% |
| Interquartile 25% (IQ1) | 3.2% | 3.0% |
| Interquartile 75% (IQ3) | 5.0% | 7.0% |
| Interquartile Range (IQR) | 1.8% | 4.0% |
| Standard Deviation (Sample) | 2.1% | 3.1% |
| Standard Deviation (Population) | 2.1% | 3.0% |
Similar Demographics by Hearing Disability
Demographics Similar to Hawaiians by Hearing Disability
In terms of hearing disability, the demographic groups most similar to Hawaiians are Portuguese (3.5%, a difference of 0.040%), Slovene (3.5%, a difference of 0.11%), Immigrants from North America (3.5%, a difference of 0.11%), Immigrants from Canada (3.5%, a difference of 0.16%), and Northern European (3.4%, a difference of 0.35%).
| Demographics | Rating | Rank | Hearing Disability |
| Slavs | 0.2 /100 | #254 | Tragic 3.4% |
| Poles | 0.2 /100 | #255 | Tragic 3.4% |
| Hmong | 0.2 /100 | #256 | Tragic 3.4% |
| Yaqui | 0.2 /100 | #257 | Tragic 3.4% |
| Northern Europeans | 0.2 /100 | #258 | Tragic 3.4% |
| Slovenes | 0.1 /100 | #259 | Tragic 3.5% |
| Portuguese | 0.1 /100 | #260 | Tragic 3.5% |
| Hawaiians | 0.1 /100 | #261 | Tragic 3.5% |
| Immigrants | North America | 0.1 /100 | #262 | Tragic 3.5% |
| Immigrants | Canada | 0.1 /100 | #263 | Tragic 3.5% |
| Immigrants | Germany | 0.1 /100 | #264 | Tragic 3.5% |
| British | 0.1 /100 | #265 | Tragic 3.5% |
| Belgians | 0.1 /100 | #266 | Tragic 3.5% |
| Canadians | 0.1 /100 | #267 | Tragic 3.5% |
| Spaniards | 0.1 /100 | #268 | Tragic 3.5% |
Demographics Similar to Menominee by Hearing Disability
In terms of hearing disability, the demographic groups most similar to Menominee are Dutch (3.7%, a difference of 0.060%), Pennsylvania German (3.7%, a difference of 0.16%), Scottish (3.7%, a difference of 0.19%), German (3.7%, a difference of 0.25%), and French (3.8%, a difference of 0.30%).
| Demographics | Rating | Rank | Hearing Disability |
| Pima | 0.0 /100 | #296 | Tragic 3.7% |
| Immigrants | Azores | 0.0 /100 | #297 | Tragic 3.7% |
| Celtics | 0.0 /100 | #298 | Tragic 3.7% |
| Germans | 0.0 /100 | #299 | Tragic 3.7% |
| Scottish | 0.0 /100 | #300 | Tragic 3.7% |
| Pennsylvania Germans | 0.0 /100 | #301 | Tragic 3.7% |
| Dutch | 0.0 /100 | #302 | Tragic 3.7% |
| Menominee | 0.0 /100 | #303 | Tragic 3.7% |
| French | 0.0 /100 | #304 | Tragic 3.8% |
| English | 0.0 /100 | #305 | Tragic 3.8% |
| Marshallese | 0.0 /100 | #306 | Tragic 3.8% |
| French Canadians | 0.0 /100 | #307 | Tragic 3.8% |
| Ottawa | 0.0 /100 | #308 | Tragic 3.8% |
| Scotch-Irish | 0.0 /100 | #309 | Tragic 3.8% |
| Cree | 0.0 /100 | #310 | Tragic 3.8% |