Ecuadorian vs Immigrants from Uzbekistan Hearing Disability
COMPARE
Ecuadorian
Immigrants from Uzbekistan
Hearing Disability
Hearing Disability Comparison
Ecuadorians
Immigrants from Uzbekistan
2.5%
HEARING DISABILITY
99.9/ 100
METRIC RATING
14th/ 347
METRIC RANK
2.7%
HEARING DISABILITY
98.4/ 100
METRIC RATING
61st/ 347
METRIC RANK
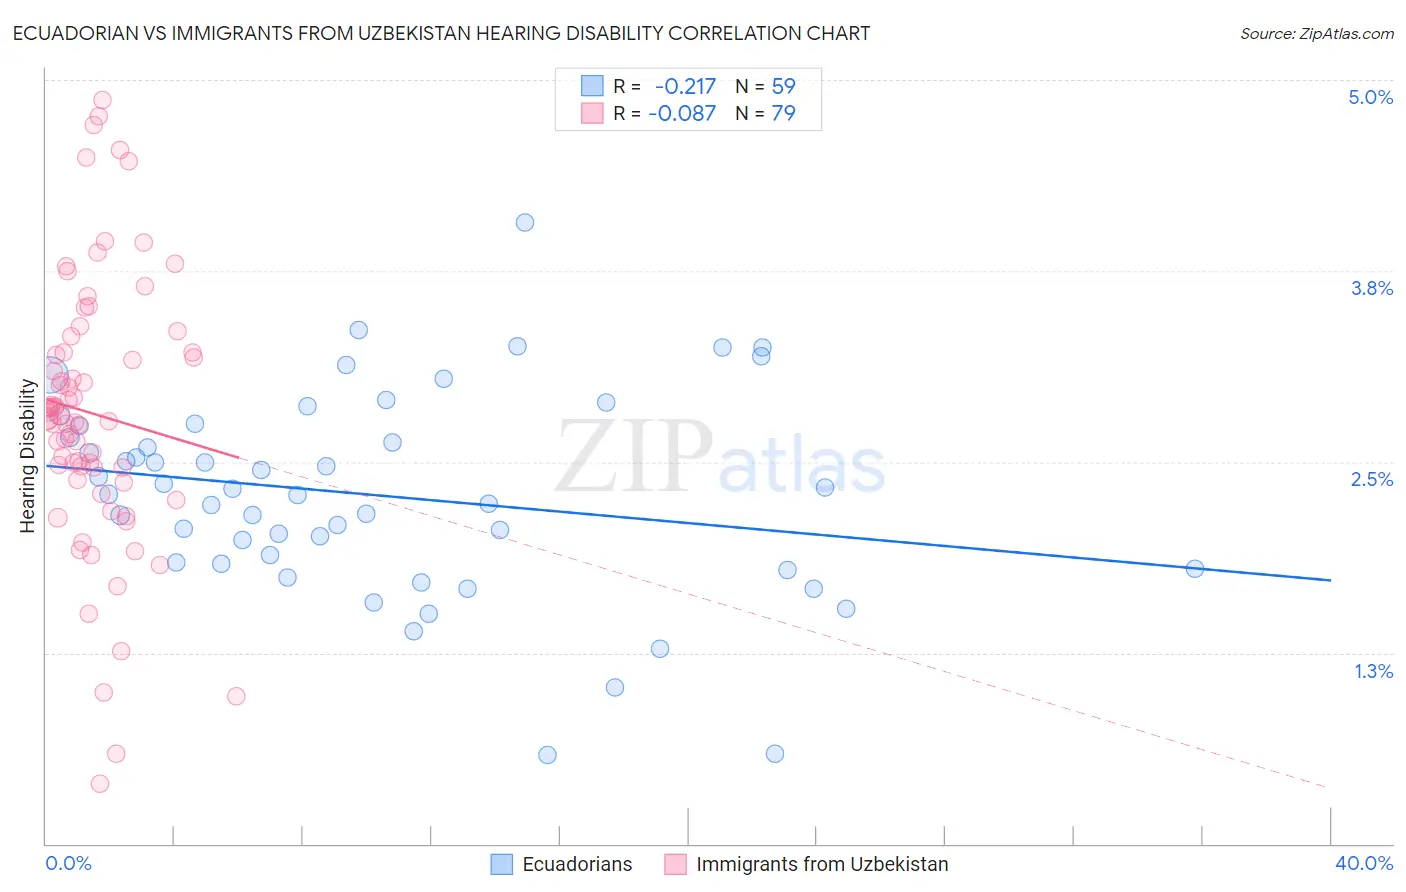
Ecuadorian vs Immigrants from Uzbekistan Hearing Disability Correlation Chart
The statistical analysis conducted on geographies consisting of 317,698,915 people shows a weak negative correlation between the proportion of Ecuadorians and percentage of population with hearing disability in the United States with a correlation coefficient (R) of -0.217 and weighted average of 2.5%. Similarly, the statistical analysis conducted on geographies consisting of 118,732,772 people shows a slight negative correlation between the proportion of Immigrants from Uzbekistan and percentage of population with hearing disability in the United States with a correlation coefficient (R) of -0.087 and weighted average of 2.7%, a difference of 7.8%.
Hearing Disability Correlation Summary
| Measurement | Ecuadorian | Immigrants from Uzbekistan |
| Minimum | 0.58% | 0.39% |
| Maximum | 4.1% | 4.9% |
| Range | 3.5% | 4.5% |
| Mean | 2.3% | 2.8% |
| Median | 2.3% | 2.8% |
| Interquartile 25% (IQ1) | 1.8% | 2.4% |
| Interquartile 75% (IQ3) | 2.7% | 3.2% |
| Interquartile Range (IQR) | 0.90% | 0.84% |
| Standard Deviation (Sample) | 0.67% | 0.89% |
| Standard Deviation (Population) | 0.66% | 0.88% |
Similar Demographics by Hearing Disability
Demographics Similar to Ecuadorians by Hearing Disability
In terms of hearing disability, the demographic groups most similar to Ecuadorians are Barbadian (2.5%, a difference of 0.30%), Sierra Leonean (2.5%, a difference of 0.32%), Immigrants from West Indies (2.5%, a difference of 0.45%), Trinidadian and Tobagonian (2.5%, a difference of 0.54%), and Immigrants from India (2.5%, a difference of 0.77%).
| Demographics | Rating | Rank | Hearing Disability |
| Immigrants | Bangladesh | 100.0 /100 | #7 | Exceptional 2.4% |
| British West Indians | 100.0 /100 | #8 | Exceptional 2.4% |
| Immigrants | Dominican Republic | 100.0 /100 | #9 | Exceptional 2.4% |
| Immigrants | Ecuador | 99.9 /100 | #10 | Exceptional 2.5% |
| Immigrants | Trinidad and Tobago | 99.9 /100 | #11 | Exceptional 2.5% |
| Trinidadians and Tobagonians | 99.9 /100 | #12 | Exceptional 2.5% |
| Sierra Leoneans | 99.9 /100 | #13 | Exceptional 2.5% |
| Ecuadorians | 99.9 /100 | #14 | Exceptional 2.5% |
| Barbadians | 99.9 /100 | #15 | Exceptional 2.5% |
| Immigrants | West Indies | 99.9 /100 | #16 | Exceptional 2.5% |
| Immigrants | India | 99.9 /100 | #17 | Exceptional 2.5% |
| Dominicans | 99.8 /100 | #18 | Exceptional 2.5% |
| Thais | 99.8 /100 | #19 | Exceptional 2.5% |
| Immigrants | Bolivia | 99.8 /100 | #20 | Exceptional 2.5% |
| Ghanaians | 99.8 /100 | #21 | Exceptional 2.5% |
Demographics Similar to Immigrants from Uzbekistan by Hearing Disability
In terms of hearing disability, the demographic groups most similar to Immigrants from Uzbekistan are Immigrants from Colombia (2.7%, a difference of 0.0%), Indian (Asian) (2.7%, a difference of 0.060%), Immigrants from Sri Lanka (2.7%, a difference of 0.11%), Immigrants from Egypt (2.7%, a difference of 0.13%), and Immigrants from Nepal (2.7%, a difference of 0.19%).
| Demographics | Rating | Rank | Hearing Disability |
| Ethiopians | 99.0 /100 | #54 | Exceptional 2.7% |
| Immigrants | Ethiopia | 99.0 /100 | #55 | Exceptional 2.7% |
| Immigrants | Nicaragua | 99.0 /100 | #56 | Exceptional 2.7% |
| South Americans | 99.0 /100 | #57 | Exceptional 2.7% |
| Immigrants | Peru | 98.6 /100 | #58 | Exceptional 2.7% |
| Immigrants | Eritrea | 98.5 /100 | #59 | Exceptional 2.7% |
| Immigrants | Egypt | 98.5 /100 | #60 | Exceptional 2.7% |
| Immigrants | Uzbekistan | 98.4 /100 | #61 | Exceptional 2.7% |
| Immigrants | Colombia | 98.4 /100 | #62 | Exceptional 2.7% |
| Indians (Asian) | 98.4 /100 | #63 | Exceptional 2.7% |
| Immigrants | Sri Lanka | 98.4 /100 | #64 | Exceptional 2.7% |
| Immigrants | Nepal | 98.3 /100 | #65 | Exceptional 2.7% |
| Immigrants | Belize | 98.2 /100 | #66 | Exceptional 2.7% |
| Egyptians | 98.1 /100 | #67 | Exceptional 2.7% |
| Immigrants | Africa | 98.0 /100 | #68 | Exceptional 2.7% |