Ecuadorian vs Laotian Hearing Disability
COMPARE
Ecuadorian
Laotian
Hearing Disability
Hearing Disability Comparison
Ecuadorians
Laotians
2.5%
HEARING DISABILITY
99.9/ 100
METRIC RATING
14th/ 347
METRIC RANK
2.9%
HEARING DISABILITY
81.1/ 100
METRIC RATING
142nd/ 347
METRIC RANK
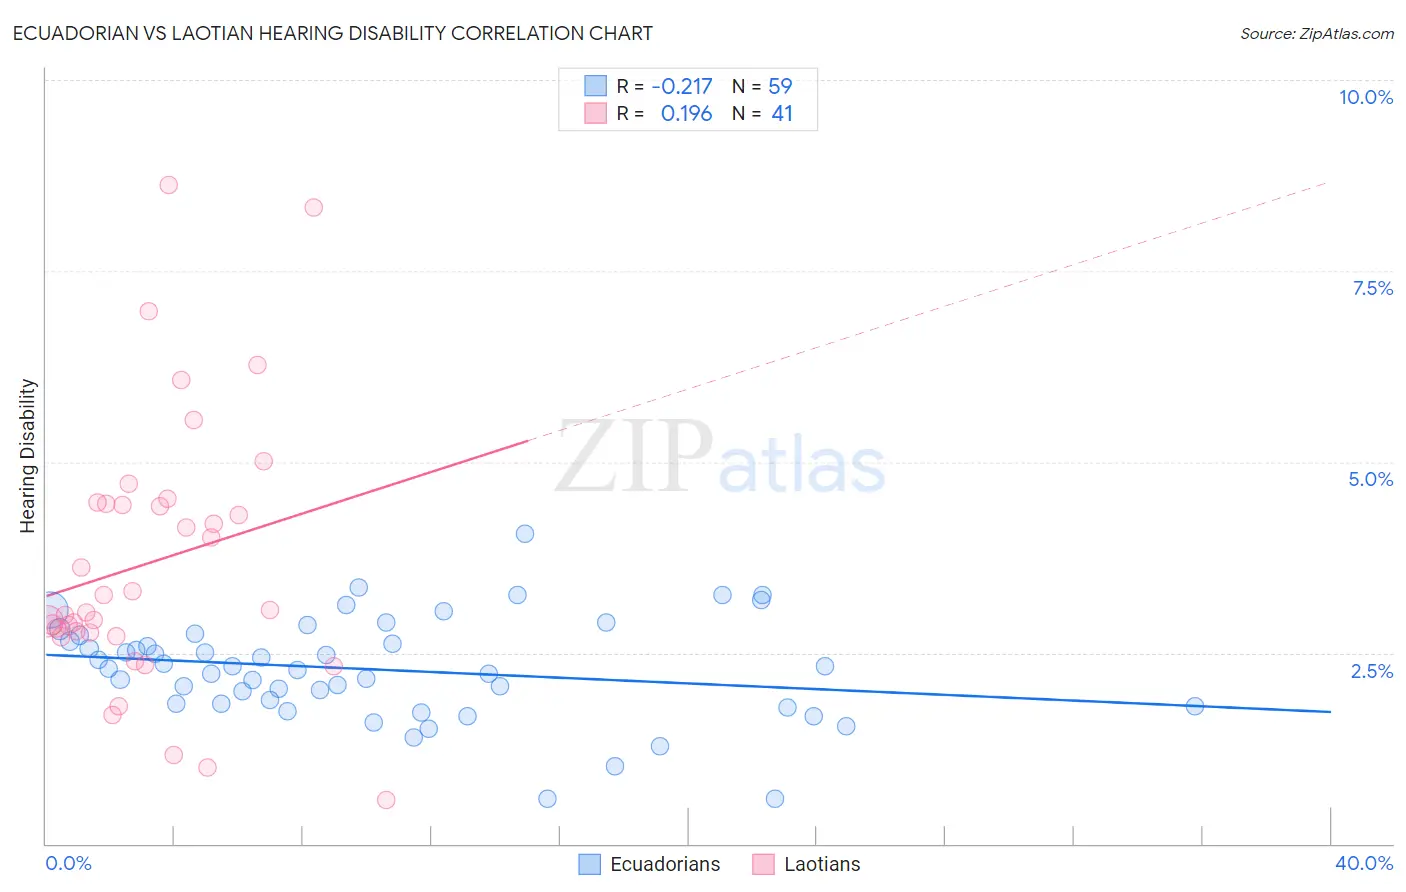
Ecuadorian vs Laotian Hearing Disability Correlation Chart
The statistical analysis conducted on geographies consisting of 317,698,915 people shows a weak negative correlation between the proportion of Ecuadorians and percentage of population with hearing disability in the United States with a correlation coefficient (R) of -0.217 and weighted average of 2.5%. Similarly, the statistical analysis conducted on geographies consisting of 224,832,654 people shows a poor positive correlation between the proportion of Laotians and percentage of population with hearing disability in the United States with a correlation coefficient (R) of 0.196 and weighted average of 2.9%, a difference of 15.3%.
Hearing Disability Correlation Summary
| Measurement | Ecuadorian | Laotian |
| Minimum | 0.58% | 0.57% |
| Maximum | 4.1% | 8.6% |
| Range | 3.5% | 8.0% |
| Mean | 2.3% | 3.7% |
| Median | 2.3% | 3.1% |
| Interquartile 25% (IQ1) | 1.8% | 2.7% |
| Interquartile 75% (IQ3) | 2.7% | 4.5% |
| Interquartile Range (IQR) | 0.90% | 1.7% |
| Standard Deviation (Sample) | 0.67% | 1.8% |
| Standard Deviation (Population) | 0.66% | 1.7% |
Similar Demographics by Hearing Disability
Demographics Similar to Ecuadorians by Hearing Disability
In terms of hearing disability, the demographic groups most similar to Ecuadorians are Barbadian (2.5%, a difference of 0.30%), Sierra Leonean (2.5%, a difference of 0.32%), Immigrants from West Indies (2.5%, a difference of 0.45%), Trinidadian and Tobagonian (2.5%, a difference of 0.54%), and Immigrants from India (2.5%, a difference of 0.77%).
| Demographics | Rating | Rank | Hearing Disability |
| Immigrants | Bangladesh | 100.0 /100 | #7 | Exceptional 2.4% |
| British West Indians | 100.0 /100 | #8 | Exceptional 2.4% |
| Immigrants | Dominican Republic | 100.0 /100 | #9 | Exceptional 2.4% |
| Immigrants | Ecuador | 99.9 /100 | #10 | Exceptional 2.5% |
| Immigrants | Trinidad and Tobago | 99.9 /100 | #11 | Exceptional 2.5% |
| Trinidadians and Tobagonians | 99.9 /100 | #12 | Exceptional 2.5% |
| Sierra Leoneans | 99.9 /100 | #13 | Exceptional 2.5% |
| Ecuadorians | 99.9 /100 | #14 | Exceptional 2.5% |
| Barbadians | 99.9 /100 | #15 | Exceptional 2.5% |
| Immigrants | West Indies | 99.9 /100 | #16 | Exceptional 2.5% |
| Immigrants | India | 99.9 /100 | #17 | Exceptional 2.5% |
| Dominicans | 99.8 /100 | #18 | Exceptional 2.5% |
| Thais | 99.8 /100 | #19 | Exceptional 2.5% |
| Immigrants | Bolivia | 99.8 /100 | #20 | Exceptional 2.5% |
| Ghanaians | 99.8 /100 | #21 | Exceptional 2.5% |
Demographics Similar to Laotians by Hearing Disability
In terms of hearing disability, the demographic groups most similar to Laotians are Immigrants from Bahamas (2.9%, a difference of 0.020%), Immigrants from Bulgaria (2.9%, a difference of 0.29%), Immigrants from Congo (2.9%, a difference of 0.34%), Brazilian (2.9%, a difference of 0.36%), and Subsaharan African (2.9%, a difference of 0.37%).
| Demographics | Rating | Rank | Hearing Disability |
| Soviet Union | 84.8 /100 | #135 | Excellent 2.9% |
| Immigrants | Brazil | 84.6 /100 | #136 | Excellent 2.9% |
| Sri Lankans | 84.1 /100 | #137 | Excellent 2.9% |
| Immigrants | Costa Rica | 84.0 /100 | #138 | Excellent 2.9% |
| Bermudans | 83.8 /100 | #139 | Excellent 2.9% |
| Immigrants | Jordan | 83.7 /100 | #140 | Excellent 2.9% |
| Sub-Saharan Africans | 83.3 /100 | #141 | Excellent 2.9% |
| Laotians | 81.1 /100 | #142 | Excellent 2.9% |
| Immigrants | Bahamas | 80.9 /100 | #143 | Excellent 2.9% |
| Immigrants | Bulgaria | 79.2 /100 | #144 | Good 2.9% |
| Immigrants | Congo | 78.9 /100 | #145 | Good 2.9% |
| Brazilians | 78.7 /100 | #146 | Good 2.9% |
| Tongans | 78.6 /100 | #147 | Good 2.9% |
| Immigrants | Russia | 77.7 /100 | #148 | Good 2.9% |
| Immigrants | Panama | 76.9 /100 | #149 | Good 2.9% |