Immigrants from Bahamas vs Menominee Hearing Disability
COMPARE
Immigrants from Bahamas
Menominee
Hearing Disability
Hearing Disability Comparison
Immigrants from Bahamas
Menominee
2.9%
HEARING DISABILITY
80.9/ 100
METRIC RATING
143rd/ 347
METRIC RANK
3.7%
HEARING DISABILITY
0.0/ 100
METRIC RATING
303rd/ 347
METRIC RANK
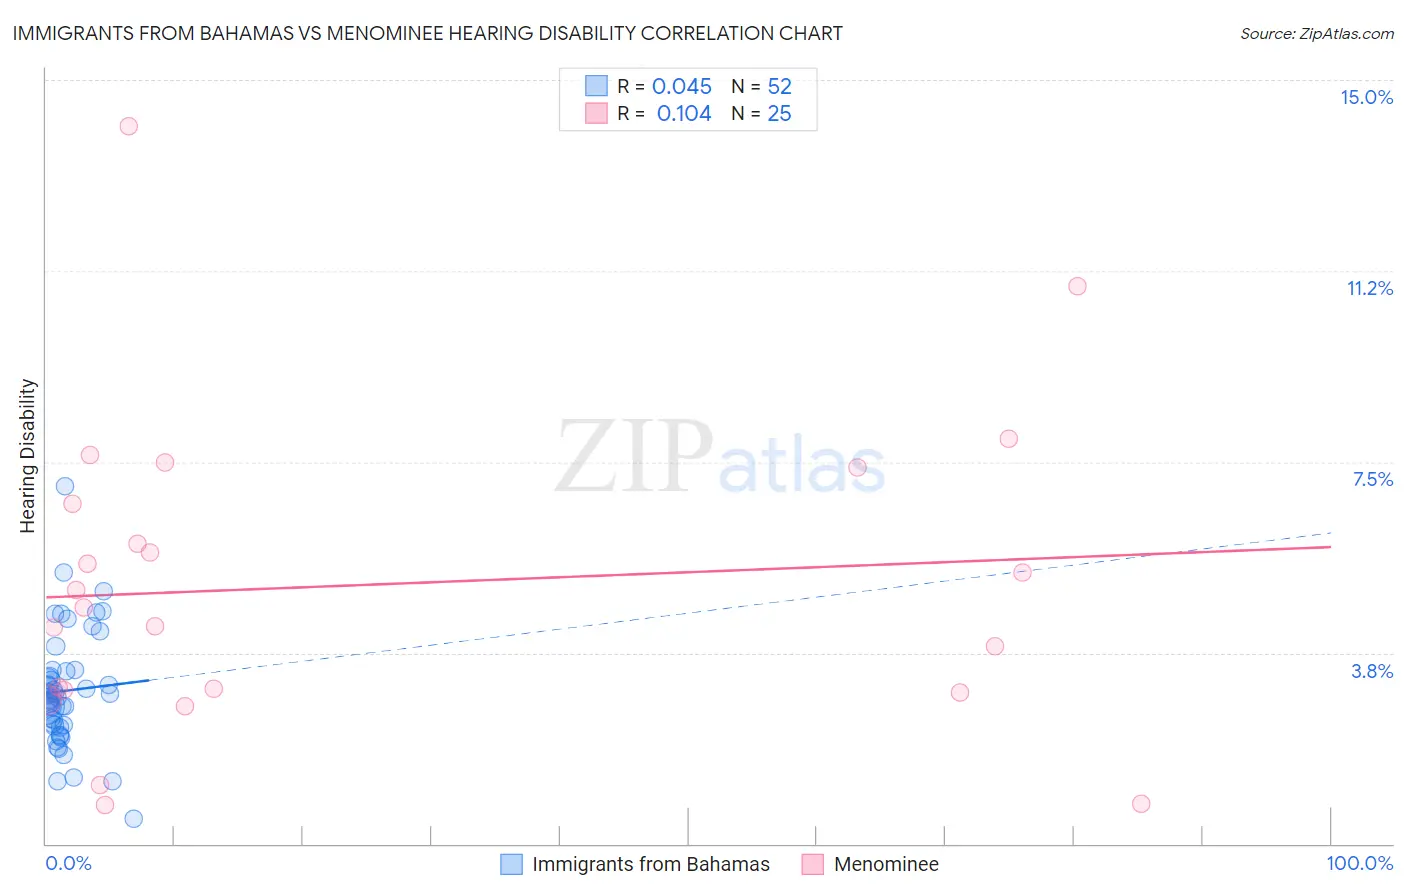
Immigrants from Bahamas vs Menominee Hearing Disability Correlation Chart
The statistical analysis conducted on geographies consisting of 104,634,972 people shows no correlation between the proportion of Immigrants from Bahamas and percentage of population with hearing disability in the United States with a correlation coefficient (R) of 0.045 and weighted average of 2.9%. Similarly, the statistical analysis conducted on geographies consisting of 45,777,415 people shows a poor positive correlation between the proportion of Menominee and percentage of population with hearing disability in the United States with a correlation coefficient (R) of 0.104 and weighted average of 3.7%, a difference of 29.3%.
Hearing Disability Correlation Summary
| Measurement | Immigrants from Bahamas | Menominee |
| Minimum | 0.49% | 0.77% |
| Maximum | 7.0% | 14.1% |
| Range | 6.5% | 13.3% |
| Mean | 3.0% | 5.1% |
| Median | 2.9% | 4.6% |
| Interquartile 25% (IQ1) | 2.3% | 3.0% |
| Interquartile 75% (IQ3) | 3.4% | 7.0% |
| Interquartile Range (IQR) | 1.1% | 4.0% |
| Standard Deviation (Sample) | 1.2% | 3.1% |
| Standard Deviation (Population) | 1.1% | 3.0% |
Similar Demographics by Hearing Disability
Demographics Similar to Immigrants from Bahamas by Hearing Disability
In terms of hearing disability, the demographic groups most similar to Immigrants from Bahamas are Laotian (2.9%, a difference of 0.020%), Immigrants from Bulgaria (2.9%, a difference of 0.27%), Immigrants from Congo (2.9%, a difference of 0.31%), Brazilian (2.9%, a difference of 0.33%), and Tongan (2.9%, a difference of 0.35%).
| Demographics | Rating | Rank | Hearing Disability |
| Immigrants | Brazil | 84.6 /100 | #136 | Excellent 2.9% |
| Sri Lankans | 84.1 /100 | #137 | Excellent 2.9% |
| Immigrants | Costa Rica | 84.0 /100 | #138 | Excellent 2.9% |
| Bermudans | 83.8 /100 | #139 | Excellent 2.9% |
| Immigrants | Jordan | 83.7 /100 | #140 | Excellent 2.9% |
| Sub-Saharan Africans | 83.3 /100 | #141 | Excellent 2.9% |
| Laotians | 81.1 /100 | #142 | Excellent 2.9% |
| Immigrants | Bahamas | 80.9 /100 | #143 | Excellent 2.9% |
| Immigrants | Bulgaria | 79.2 /100 | #144 | Good 2.9% |
| Immigrants | Congo | 78.9 /100 | #145 | Good 2.9% |
| Brazilians | 78.7 /100 | #146 | Good 2.9% |
| Tongans | 78.6 /100 | #147 | Good 2.9% |
| Immigrants | Russia | 77.7 /100 | #148 | Good 2.9% |
| Immigrants | Panama | 76.9 /100 | #149 | Good 2.9% |
| Palestinians | 73.6 /100 | #150 | Good 2.9% |
Demographics Similar to Menominee by Hearing Disability
In terms of hearing disability, the demographic groups most similar to Menominee are Dutch (3.7%, a difference of 0.060%), Pennsylvania German (3.7%, a difference of 0.16%), Scottish (3.7%, a difference of 0.19%), German (3.7%, a difference of 0.25%), and French (3.8%, a difference of 0.30%).
| Demographics | Rating | Rank | Hearing Disability |
| Pima | 0.0 /100 | #296 | Tragic 3.7% |
| Immigrants | Azores | 0.0 /100 | #297 | Tragic 3.7% |
| Celtics | 0.0 /100 | #298 | Tragic 3.7% |
| Germans | 0.0 /100 | #299 | Tragic 3.7% |
| Scottish | 0.0 /100 | #300 | Tragic 3.7% |
| Pennsylvania Germans | 0.0 /100 | #301 | Tragic 3.7% |
| Dutch | 0.0 /100 | #302 | Tragic 3.7% |
| Menominee | 0.0 /100 | #303 | Tragic 3.7% |
| French | 0.0 /100 | #304 | Tragic 3.8% |
| English | 0.0 /100 | #305 | Tragic 3.8% |
| Marshallese | 0.0 /100 | #306 | Tragic 3.8% |
| French Canadians | 0.0 /100 | #307 | Tragic 3.8% |
| Ottawa | 0.0 /100 | #308 | Tragic 3.8% |
| Scotch-Irish | 0.0 /100 | #309 | Tragic 3.8% |
| Cree | 0.0 /100 | #310 | Tragic 3.8% |