Immigrants from Senegal vs Menominee Hearing Disability
COMPARE
Immigrants from Senegal
Menominee
Hearing Disability
Hearing Disability Comparison
Immigrants from Senegal
Menominee
2.6%
HEARING DISABILITY
99.7/ 100
METRIC RATING
26th/ 347
METRIC RANK
3.7%
HEARING DISABILITY
0.0/ 100
METRIC RATING
303rd/ 347
METRIC RANK
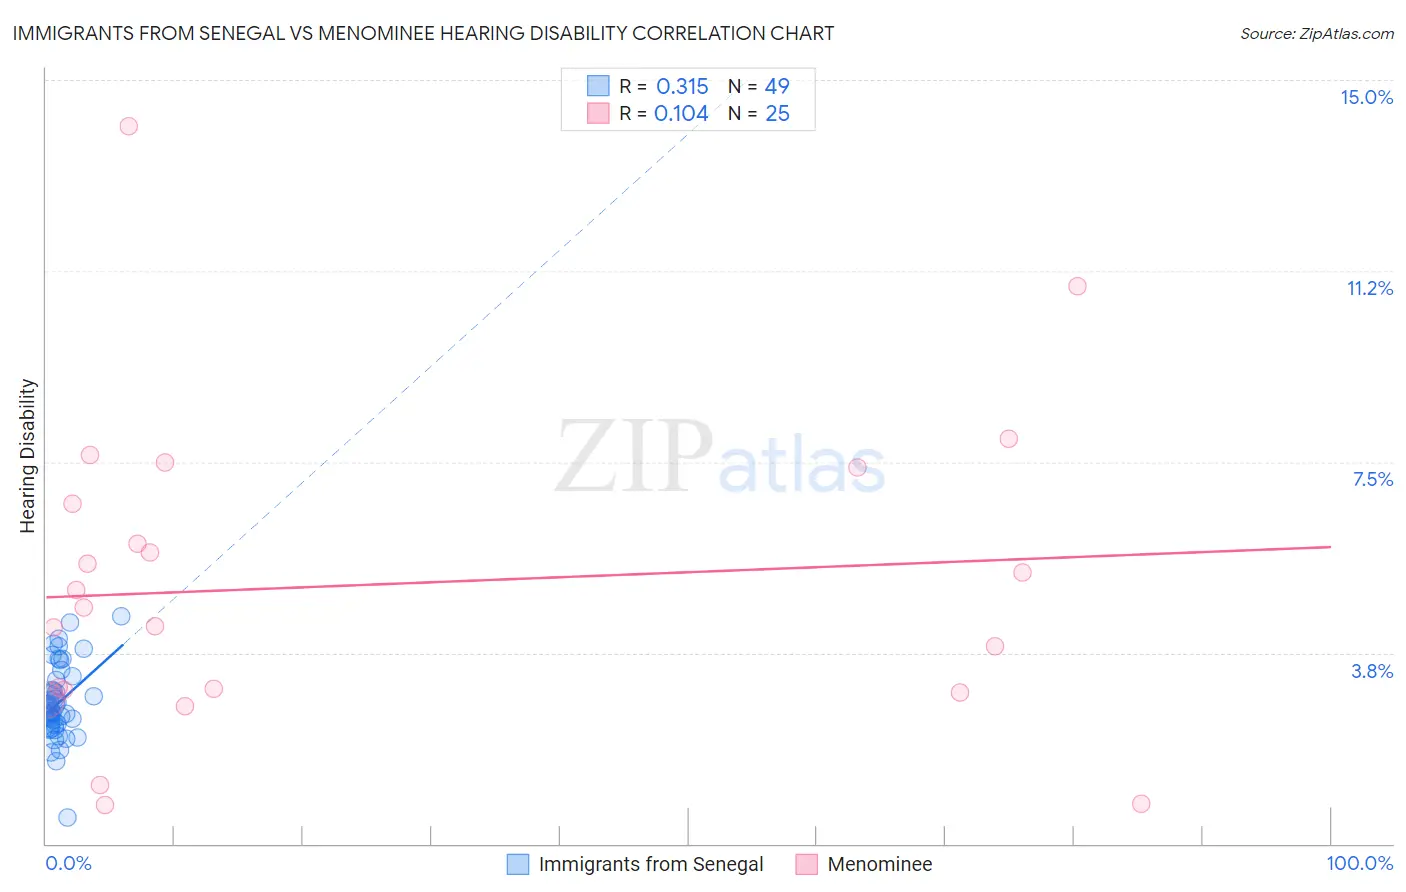
Immigrants from Senegal vs Menominee Hearing Disability Correlation Chart
The statistical analysis conducted on geographies consisting of 90,120,921 people shows a mild positive correlation between the proportion of Immigrants from Senegal and percentage of population with hearing disability in the United States with a correlation coefficient (R) of 0.315 and weighted average of 2.6%. Similarly, the statistical analysis conducted on geographies consisting of 45,777,415 people shows a poor positive correlation between the proportion of Menominee and percentage of population with hearing disability in the United States with a correlation coefficient (R) of 0.104 and weighted average of 3.7%, a difference of 45.0%.
Hearing Disability Correlation Summary
| Measurement | Immigrants from Senegal | Menominee |
| Minimum | 0.50% | 0.77% |
| Maximum | 4.5% | 14.1% |
| Range | 4.0% | 13.3% |
| Mean | 2.8% | 5.1% |
| Median | 2.6% | 4.6% |
| Interquartile 25% (IQ1) | 2.3% | 3.0% |
| Interquartile 75% (IQ3) | 3.3% | 7.0% |
| Interquartile Range (IQR) | 0.92% | 4.0% |
| Standard Deviation (Sample) | 0.75% | 3.1% |
| Standard Deviation (Population) | 0.74% | 3.0% |
Similar Demographics by Hearing Disability
Demographics Similar to Immigrants from Senegal by Hearing Disability
In terms of hearing disability, the demographic groups most similar to Immigrants from Senegal are Immigrants from El Salvador (2.6%, a difference of 0.010%), Immigrants from South Central Asia (2.6%, a difference of 0.040%), Immigrants from Ghana (2.6%, a difference of 0.41%), Immigrants from Haiti (2.6%, a difference of 0.41%), and Bolivian (2.6%, a difference of 0.43%).
| Demographics | Rating | Rank | Hearing Disability |
| Thais | 99.8 /100 | #19 | Exceptional 2.5% |
| Immigrants | Bolivia | 99.8 /100 | #20 | Exceptional 2.5% |
| Ghanaians | 99.8 /100 | #21 | Exceptional 2.5% |
| Immigrants | Sierra Leone | 99.8 /100 | #22 | Exceptional 2.6% |
| Immigrants | Nigeria | 99.8 /100 | #23 | Exceptional 2.6% |
| Immigrants | Ghana | 99.8 /100 | #24 | Exceptional 2.6% |
| Immigrants | El Salvador | 99.7 /100 | #25 | Exceptional 2.6% |
| Immigrants | Senegal | 99.7 /100 | #26 | Exceptional 2.6% |
| Immigrants | South Central Asia | 99.7 /100 | #27 | Exceptional 2.6% |
| Immigrants | Haiti | 99.7 /100 | #28 | Exceptional 2.6% |
| Bolivians | 99.7 /100 | #29 | Exceptional 2.6% |
| Immigrants | Caribbean | 99.7 /100 | #30 | Exceptional 2.6% |
| Immigrants | Cameroon | 99.7 /100 | #31 | Exceptional 2.6% |
| Immigrants | Venezuela | 99.7 /100 | #32 | Exceptional 2.6% |
| Filipinos | 99.6 /100 | #33 | Exceptional 2.6% |
Demographics Similar to Menominee by Hearing Disability
In terms of hearing disability, the demographic groups most similar to Menominee are Dutch (3.7%, a difference of 0.060%), Pennsylvania German (3.7%, a difference of 0.16%), Scottish (3.7%, a difference of 0.19%), German (3.7%, a difference of 0.25%), and French (3.8%, a difference of 0.30%).
| Demographics | Rating | Rank | Hearing Disability |
| Pima | 0.0 /100 | #296 | Tragic 3.7% |
| Immigrants | Azores | 0.0 /100 | #297 | Tragic 3.7% |
| Celtics | 0.0 /100 | #298 | Tragic 3.7% |
| Germans | 0.0 /100 | #299 | Tragic 3.7% |
| Scottish | 0.0 /100 | #300 | Tragic 3.7% |
| Pennsylvania Germans | 0.0 /100 | #301 | Tragic 3.7% |
| Dutch | 0.0 /100 | #302 | Tragic 3.7% |
| Menominee | 0.0 /100 | #303 | Tragic 3.7% |
| French | 0.0 /100 | #304 | Tragic 3.8% |
| English | 0.0 /100 | #305 | Tragic 3.8% |
| Marshallese | 0.0 /100 | #306 | Tragic 3.8% |
| French Canadians | 0.0 /100 | #307 | Tragic 3.8% |
| Ottawa | 0.0 /100 | #308 | Tragic 3.8% |
| Scotch-Irish | 0.0 /100 | #309 | Tragic 3.8% |
| Cree | 0.0 /100 | #310 | Tragic 3.8% |