Immigrants from Bangladesh vs Menominee Hearing Disability
COMPARE
Immigrants from Bangladesh
Menominee
Hearing Disability
Hearing Disability Comparison
Immigrants from Bangladesh
Menominee
2.4%
HEARING DISABILITY
100.0/ 100
METRIC RATING
7th/ 347
METRIC RANK
3.7%
HEARING DISABILITY
0.0/ 100
METRIC RATING
303rd/ 347
METRIC RANK
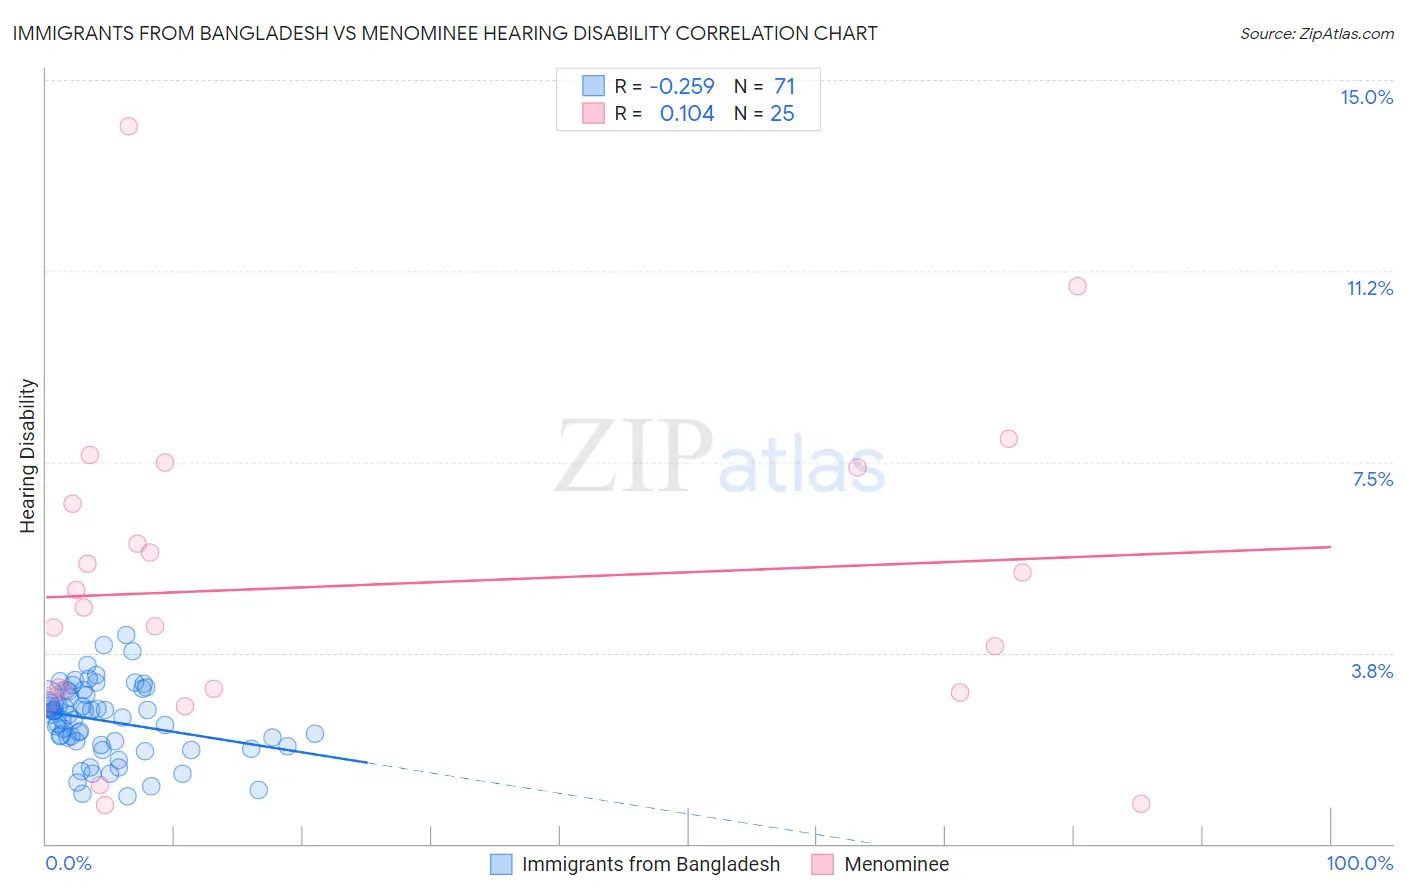
Immigrants from Bangladesh vs Menominee Hearing Disability Correlation Chart
The statistical analysis conducted on geographies consisting of 203,627,622 people shows a weak negative correlation between the proportion of Immigrants from Bangladesh and percentage of population with hearing disability in the United States with a correlation coefficient (R) of -0.259 and weighted average of 2.4%. Similarly, the statistical analysis conducted on geographies consisting of 45,777,415 people shows a poor positive correlation between the proportion of Menominee and percentage of population with hearing disability in the United States with a correlation coefficient (R) of 0.104 and weighted average of 3.7%, a difference of 54.3%.
Hearing Disability Correlation Summary
| Measurement | Immigrants from Bangladesh | Menominee |
| Minimum | 0.93% | 0.77% |
| Maximum | 4.1% | 14.1% |
| Range | 3.2% | 13.3% |
| Mean | 2.4% | 5.1% |
| Median | 2.5% | 4.6% |
| Interquartile 25% (IQ1) | 1.9% | 3.0% |
| Interquartile 75% (IQ3) | 2.9% | 7.0% |
| Interquartile Range (IQR) | 0.98% | 4.0% |
| Standard Deviation (Sample) | 0.71% | 3.1% |
| Standard Deviation (Population) | 0.70% | 3.0% |
Similar Demographics by Hearing Disability
Demographics Similar to Immigrants from Bangladesh by Hearing Disability
In terms of hearing disability, the demographic groups most similar to Immigrants from Bangladesh are British West Indian (2.4%, a difference of 0.22%), Immigrants from Dominican Republic (2.4%, a difference of 1.0%), Vietnamese (2.4%, a difference of 1.6%), Immigrants from Ecuador (2.5%, a difference of 2.0%), and Immigrants from Trinidad and Tobago (2.5%, a difference of 2.6%).
| Demographics | Rating | Rank | Hearing Disability |
| Immigrants | Grenada | 100.0 /100 | #1 | Exceptional 2.2% |
| Immigrants | St. Vincent and the Grenadines | 100.0 /100 | #2 | Exceptional 2.3% |
| Guyanese | 100.0 /100 | #3 | Exceptional 2.3% |
| Immigrants | Guyana | 100.0 /100 | #4 | Exceptional 2.3% |
| Immigrants | Barbados | 100.0 /100 | #5 | Exceptional 2.4% |
| Vietnamese | 100.0 /100 | #6 | Exceptional 2.4% |
| Immigrants | Bangladesh | 100.0 /100 | #7 | Exceptional 2.4% |
| British West Indians | 100.0 /100 | #8 | Exceptional 2.4% |
| Immigrants | Dominican Republic | 100.0 /100 | #9 | Exceptional 2.4% |
| Immigrants | Ecuador | 99.9 /100 | #10 | Exceptional 2.5% |
| Immigrants | Trinidad and Tobago | 99.9 /100 | #11 | Exceptional 2.5% |
| Trinidadians and Tobagonians | 99.9 /100 | #12 | Exceptional 2.5% |
| Sierra Leoneans | 99.9 /100 | #13 | Exceptional 2.5% |
| Ecuadorians | 99.9 /100 | #14 | Exceptional 2.5% |
| Barbadians | 99.9 /100 | #15 | Exceptional 2.5% |
Demographics Similar to Menominee by Hearing Disability
In terms of hearing disability, the demographic groups most similar to Menominee are Dutch (3.7%, a difference of 0.060%), Pennsylvania German (3.7%, a difference of 0.16%), Scottish (3.7%, a difference of 0.19%), German (3.7%, a difference of 0.25%), and French (3.8%, a difference of 0.30%).
| Demographics | Rating | Rank | Hearing Disability |
| Pima | 0.0 /100 | #296 | Tragic 3.7% |
| Immigrants | Azores | 0.0 /100 | #297 | Tragic 3.7% |
| Celtics | 0.0 /100 | #298 | Tragic 3.7% |
| Germans | 0.0 /100 | #299 | Tragic 3.7% |
| Scottish | 0.0 /100 | #300 | Tragic 3.7% |
| Pennsylvania Germans | 0.0 /100 | #301 | Tragic 3.7% |
| Dutch | 0.0 /100 | #302 | Tragic 3.7% |
| Menominee | 0.0 /100 | #303 | Tragic 3.7% |
| French | 0.0 /100 | #304 | Tragic 3.8% |
| English | 0.0 /100 | #305 | Tragic 3.8% |
| Marshallese | 0.0 /100 | #306 | Tragic 3.8% |
| French Canadians | 0.0 /100 | #307 | Tragic 3.8% |
| Ottawa | 0.0 /100 | #308 | Tragic 3.8% |
| Scotch-Irish | 0.0 /100 | #309 | Tragic 3.8% |
| Cree | 0.0 /100 | #310 | Tragic 3.8% |