Shoshone vs Ottawa Disability Age Under 5
COMPARE
Shoshone
Ottawa
Disability Age Under 5
Disability Age Under 5 Comparison
Shoshone
Ottawa
1.6%
DISABILITY AGE UNDER 5
0.0/ 100
METRIC RATING
300th/ 347
METRIC RANK
1.7%
DISABILITY AGE UNDER 5
0.0/ 100
METRIC RATING
321st/ 347
METRIC RANK
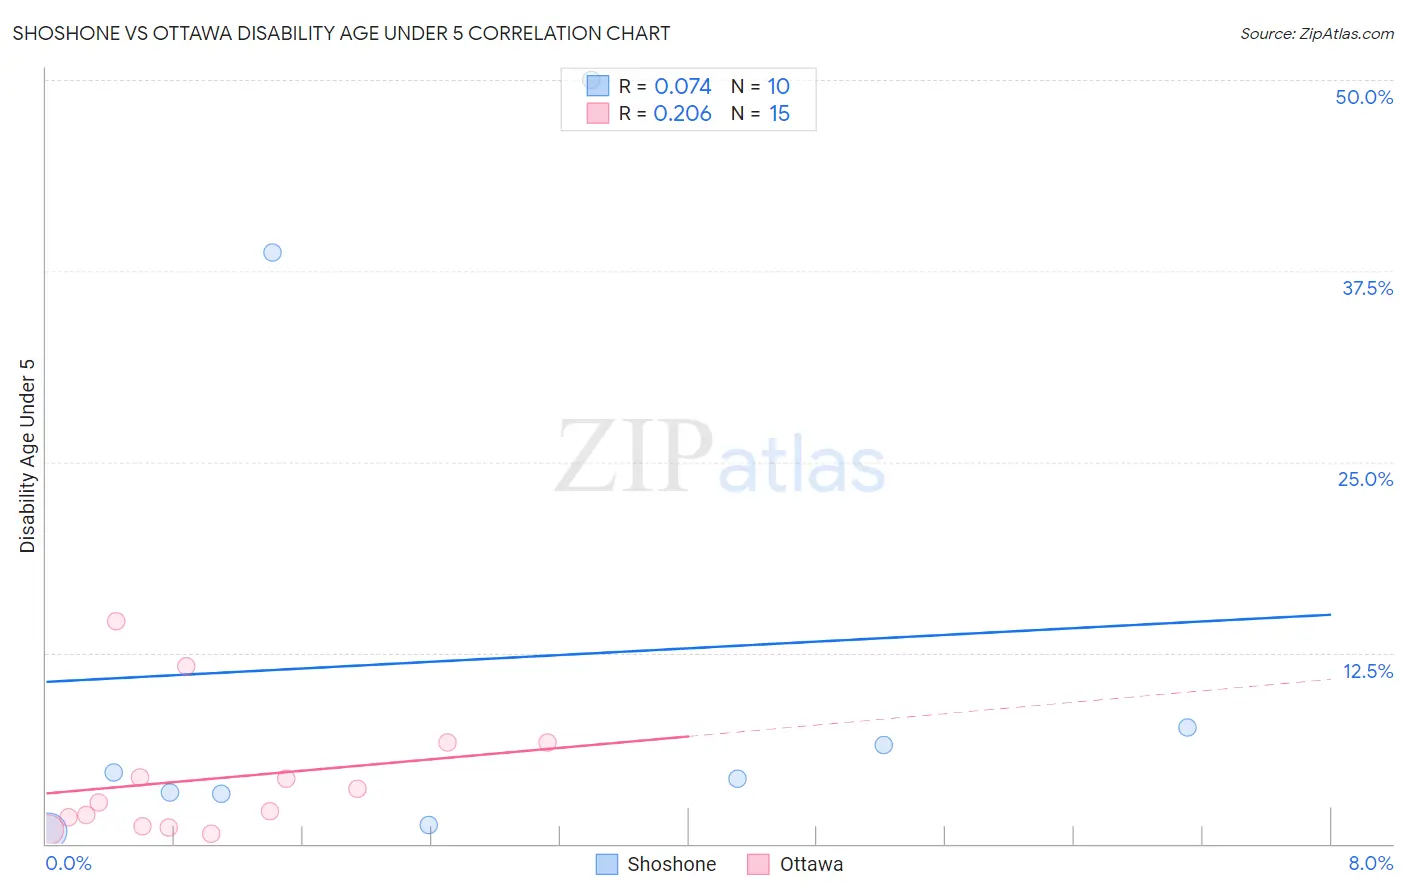
Shoshone vs Ottawa Disability Age Under 5 Correlation Chart
The statistical analysis conducted on geographies consisting of 55,591,533 people shows a slight positive correlation between the proportion of Shoshone and percentage of population with a disability under the age of 5 in the United States with a correlation coefficient (R) of 0.074 and weighted average of 1.6%. Similarly, the statistical analysis conducted on geographies consisting of 39,604,340 people shows a weak positive correlation between the proportion of Ottawa and percentage of population with a disability under the age of 5 in the United States with a correlation coefficient (R) of 0.206 and weighted average of 1.7%, a difference of 5.6%.
Disability Age Under 5 Correlation Summary
| Measurement | Shoshone | Ottawa |
| Minimum | 0.81% | 0.66% |
| Maximum | 50.0% | 14.5% |
| Range | 49.2% | 13.9% |
| Mean | 12.0% | 4.3% |
| Median | 4.5% | 2.7% |
| Interquartile 25% (IQ1) | 3.3% | 1.1% |
| Interquartile 75% (IQ3) | 7.6% | 6.6% |
| Interquartile Range (IQR) | 4.3% | 5.5% |
| Standard Deviation (Sample) | 17.4% | 4.1% |
| Standard Deviation (Population) | 16.5% | 4.0% |
Similar Demographics by Disability Age Under 5
Demographics Similar to Shoshone by Disability Age Under 5
In terms of disability age under 5, the demographic groups most similar to Shoshone are Portuguese (1.6%, a difference of 0.33%), German Russian (1.6%, a difference of 0.44%), Welsh (1.6%, a difference of 0.56%), Swiss (1.6%, a difference of 0.72%), and Nonimmigrants (1.6%, a difference of 0.91%).
| Demographics | Rating | Rank | Disability Age Under 5 |
| Lithuanians | 0.0 /100 | #293 | Tragic 1.6% |
| Swedes | 0.0 /100 | #294 | Tragic 1.6% |
| Finns | 0.0 /100 | #295 | Tragic 1.6% |
| Poles | 0.0 /100 | #296 | Tragic 1.6% |
| Immigrants | Nonimmigrants | 0.0 /100 | #297 | Tragic 1.6% |
| Cajuns | 0.0 /100 | #298 | Tragic 1.6% |
| Portuguese | 0.0 /100 | #299 | Tragic 1.6% |
| Shoshone | 0.0 /100 | #300 | Tragic 1.6% |
| German Russians | 0.0 /100 | #301 | Tragic 1.6% |
| Welsh | 0.0 /100 | #302 | Tragic 1.6% |
| Swiss | 0.0 /100 | #303 | Tragic 1.6% |
| Seminole | 0.0 /100 | #304 | Tragic 1.6% |
| Blackfeet | 0.0 /100 | #305 | Tragic 1.6% |
| Creek | 0.0 /100 | #306 | Tragic 1.6% |
| Scottish | 0.0 /100 | #307 | Tragic 1.6% |
Demographics Similar to Ottawa by Disability Age Under 5
In terms of disability age under 5, the demographic groups most similar to Ottawa are Scotch-Irish (1.7%, a difference of 0.060%), German (1.7%, a difference of 0.57%), Slovak (1.7%, a difference of 0.59%), Irish (1.7%, a difference of 0.89%), and French (1.7%, a difference of 1.2%).
| Demographics | Rating | Rank | Disability Age Under 5 |
| Norwegians | 0.0 /100 | #314 | Tragic 1.7% |
| Dutch | 0.0 /100 | #315 | Tragic 1.7% |
| Immigrants | Cabo Verde | 0.0 /100 | #316 | Tragic 1.7% |
| French | 0.0 /100 | #317 | Tragic 1.7% |
| Irish | 0.0 /100 | #318 | Tragic 1.7% |
| Slovaks | 0.0 /100 | #319 | Tragic 1.7% |
| Scotch-Irish | 0.0 /100 | #320 | Tragic 1.7% |
| Ottawa | 0.0 /100 | #321 | Tragic 1.7% |
| Germans | 0.0 /100 | #322 | Tragic 1.7% |
| Chickasaw | 0.0 /100 | #323 | Tragic 1.7% |
| Cherokee | 0.0 /100 | #324 | Tragic 1.8% |
| Immigrants | Portugal | 0.0 /100 | #325 | Tragic 1.8% |
| Sioux | 0.0 /100 | #326 | Tragic 1.8% |
| Osage | 0.0 /100 | #327 | Tragic 1.8% |
| Americans | 0.0 /100 | #328 | Tragic 1.9% |