Czechoslovakian vs Immigrants from Afghanistan Disability Age Under 5
COMPARE
Czechoslovakian
Immigrants from Afghanistan
Disability Age Under 5
Disability Age Under 5 Comparison
Czechoslovakians
Immigrants from Afghanistan
1.5%
DISABILITY AGE UNDER 5
0.0/ 100
METRIC RATING
281st/ 347
METRIC RANK
0.91%
DISABILITY AGE UNDER 5
100.0/ 100
METRIC RATING
7th/ 347
METRIC RANK
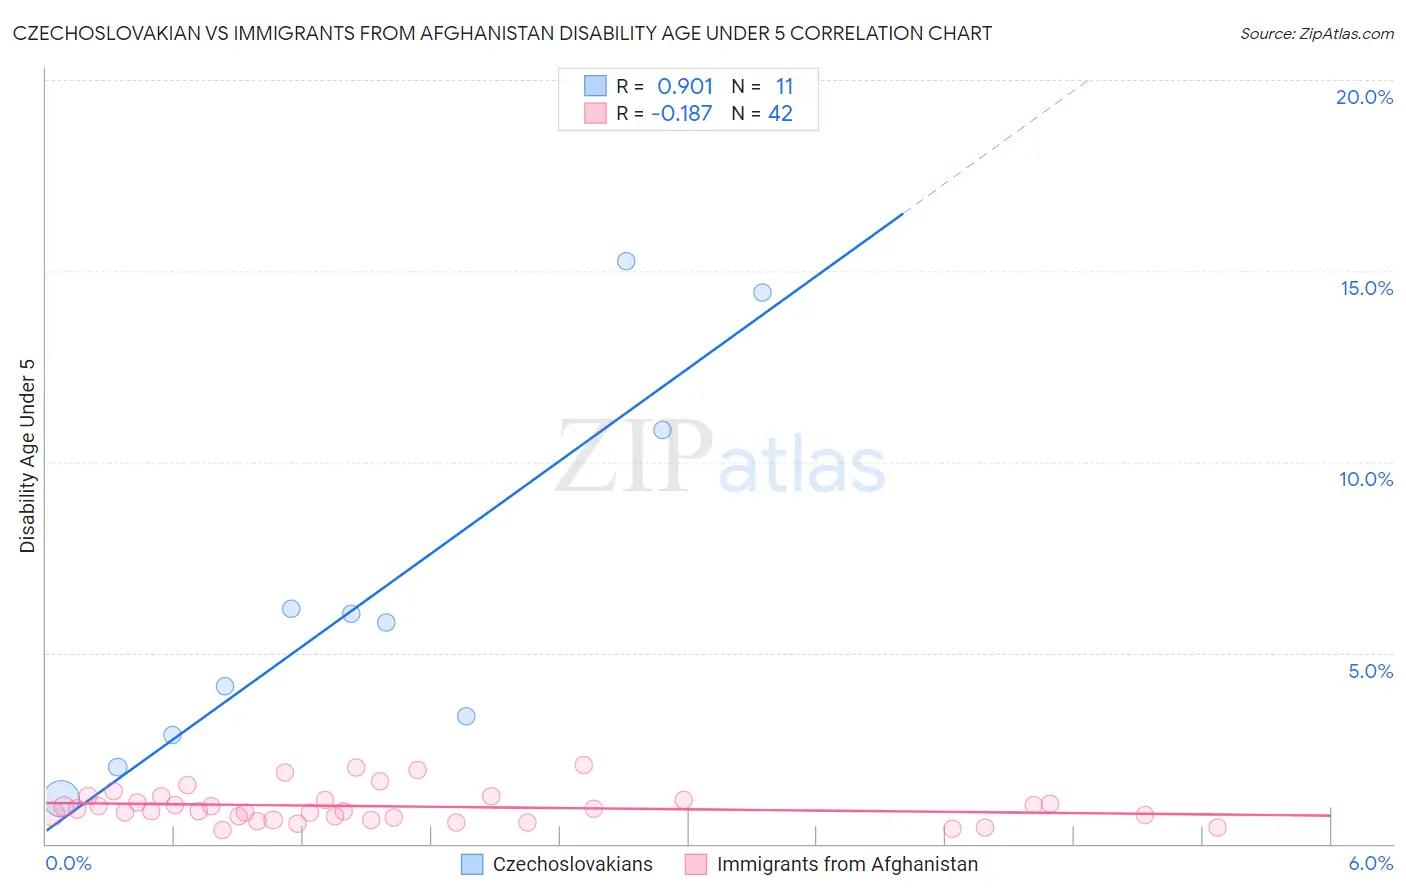
Czechoslovakian vs Immigrants from Afghanistan Disability Age Under 5 Correlation Chart
The statistical analysis conducted on geographies consisting of 199,678,332 people shows a near-perfect positive correlation between the proportion of Czechoslovakians and percentage of population with a disability under the age of 5 in the United States with a correlation coefficient (R) of 0.901 and weighted average of 1.5%. Similarly, the statistical analysis conducted on geographies consisting of 107,593,919 people shows a poor negative correlation between the proportion of Immigrants from Afghanistan and percentage of population with a disability under the age of 5 in the United States with a correlation coefficient (R) of -0.187 and weighted average of 0.91%, a difference of 66.8%.
Disability Age Under 5 Correlation Summary
| Measurement | Czechoslovakian | Immigrants from Afghanistan |
| Minimum | 1.2% | 0.36% |
| Maximum | 15.3% | 2.1% |
| Range | 14.1% | 1.7% |
| Mean | 6.5% | 0.98% |
| Median | 5.8% | 0.88% |
| Interquartile 25% (IQ1) | 2.8% | 0.68% |
| Interquartile 75% (IQ3) | 10.8% | 1.2% |
| Interquartile Range (IQR) | 8.0% | 0.47% |
| Standard Deviation (Sample) | 4.9% | 0.44% |
| Standard Deviation (Population) | 4.6% | 0.43% |
Similar Demographics by Disability Age Under 5
Demographics Similar to Czechoslovakians by Disability Age Under 5
In terms of disability age under 5, the demographic groups most similar to Czechoslovakians are Cheyenne (1.5%, a difference of 0.34%), Delaware (1.5%, a difference of 0.54%), European (1.5%, a difference of 0.59%), British (1.5%, a difference of 1.7%), and Croatian (1.5%, a difference of 1.8%).
| Demographics | Rating | Rank | Disability Age Under 5 |
| Iroquois | 0.0 /100 | #274 | Tragic 1.5% |
| Brazilians | 0.0 /100 | #275 | Tragic 1.5% |
| Greeks | 0.0 /100 | #276 | Tragic 1.5% |
| Canadians | 0.0 /100 | #277 | Tragic 1.5% |
| Kiowa | 0.0 /100 | #278 | Tragic 1.5% |
| Danes | 0.0 /100 | #279 | Tragic 1.5% |
| British | 0.0 /100 | #280 | Tragic 1.5% |
| Czechoslovakians | 0.0 /100 | #281 | Tragic 1.5% |
| Cheyenne | 0.0 /100 | #282 | Tragic 1.5% |
| Delaware | 0.0 /100 | #283 | Tragic 1.5% |
| Europeans | 0.0 /100 | #284 | Tragic 1.5% |
| Croatians | 0.0 /100 | #285 | Tragic 1.5% |
| Tlingit-Haida | 0.0 /100 | #286 | Tragic 1.5% |
| Scandinavians | 0.0 /100 | #287 | Tragic 1.5% |
| Estonians | 0.0 /100 | #288 | Tragic 1.5% |
Demographics Similar to Immigrants from Afghanistan by Disability Age Under 5
In terms of disability age under 5, the demographic groups most similar to Immigrants from Afghanistan are Immigrants from Yemen (0.91%, a difference of 0.13%), Immigrants from Fiji (0.92%, a difference of 1.2%), Marshallese (0.94%, a difference of 3.4%), Afghan (0.94%, a difference of 4.1%), and Immigrants from Grenada (0.94%, a difference of 4.2%).
| Demographics | Rating | Rank | Disability Age Under 5 |
| Immigrants | Armenia | 100.0 /100 | #1 | Exceptional 0.76% |
| Immigrants | St. Vincent and the Grenadines | 100.0 /100 | #2 | Exceptional 0.79% |
| Vietnamese | 100.0 /100 | #3 | Exceptional 0.81% |
| Immigrants | Uzbekistan | 100.0 /100 | #4 | Exceptional 0.85% |
| Immigrants | Bangladesh | 100.0 /100 | #5 | Exceptional 0.85% |
| Ute | 100.0 /100 | #6 | Exceptional 0.86% |
| Immigrants | Afghanistan | 100.0 /100 | #7 | Exceptional 0.91% |
| Immigrants | Yemen | 100.0 /100 | #8 | Exceptional 0.91% |
| Immigrants | Fiji | 100.0 /100 | #9 | Exceptional 0.92% |
| Marshallese | 100.0 /100 | #10 | Exceptional 0.94% |
| Afghans | 100.0 /100 | #11 | Exceptional 0.94% |
| Immigrants | Grenada | 100.0 /100 | #12 | Exceptional 0.94% |
| Soviet Union | 100.0 /100 | #13 | Exceptional 0.95% |
| Yuman | 100.0 /100 | #14 | Exceptional 0.95% |
| Immigrants | Hong Kong | 100.0 /100 | #15 | Exceptional 0.95% |