Czechoslovakian vs Immigrants from South Eastern Asia Disability Age Under 5
COMPARE
Czechoslovakian
Immigrants from South Eastern Asia
Disability Age Under 5
Disability Age Under 5 Comparison
Czechoslovakians
Immigrants from South Eastern Asia
1.5%
DISABILITY AGE UNDER 5
0.0/ 100
METRIC RATING
281st/ 347
METRIC RANK
1.1%
DISABILITY AGE UNDER 5
96.5/ 100
METRIC RATING
98th/ 347
METRIC RANK
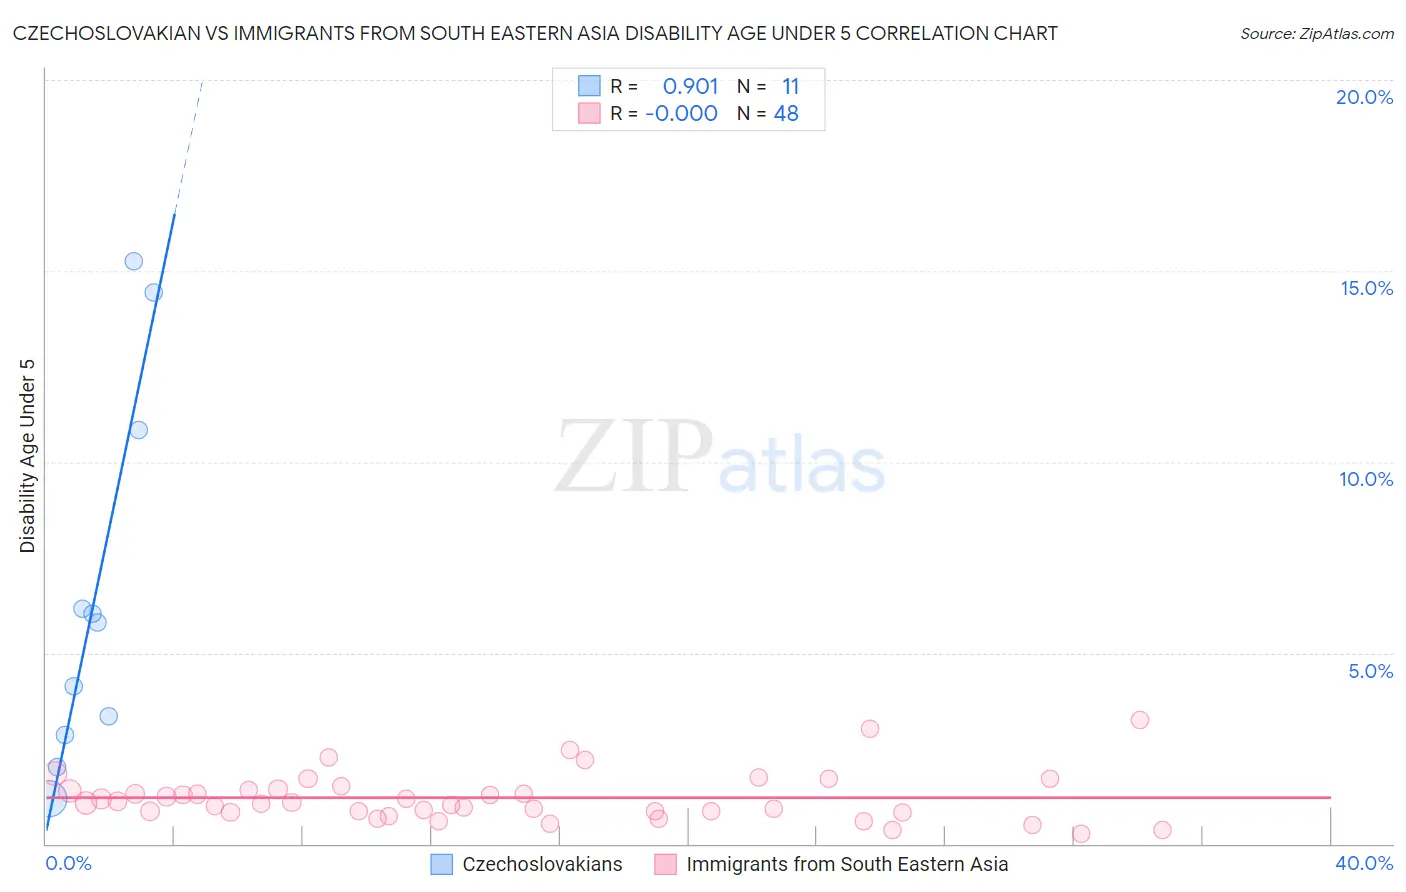
Czechoslovakian vs Immigrants from South Eastern Asia Disability Age Under 5 Correlation Chart
The statistical analysis conducted on geographies consisting of 199,678,332 people shows a near-perfect positive correlation between the proportion of Czechoslovakians and percentage of population with a disability under the age of 5 in the United States with a correlation coefficient (R) of 0.901 and weighted average of 1.5%. Similarly, the statistical analysis conducted on geographies consisting of 251,042,035 people shows no correlation between the proportion of Immigrants from South Eastern Asia and percentage of population with a disability under the age of 5 in the United States with a correlation coefficient (R) of -0.000 and weighted average of 1.1%, a difference of 31.8%.
Disability Age Under 5 Correlation Summary
| Measurement | Czechoslovakian | Immigrants from South Eastern Asia |
| Minimum | 1.2% | 0.25% |
| Maximum | 15.3% | 3.2% |
| Range | 14.1% | 3.0% |
| Mean | 6.5% | 1.2% |
| Median | 5.8% | 1.1% |
| Interquartile 25% (IQ1) | 2.8% | 0.84% |
| Interquartile 75% (IQ3) | 10.8% | 1.4% |
| Interquartile Range (IQR) | 8.0% | 0.59% |
| Standard Deviation (Sample) | 4.9% | 0.63% |
| Standard Deviation (Population) | 4.6% | 0.63% |
Similar Demographics by Disability Age Under 5
Demographics Similar to Czechoslovakians by Disability Age Under 5
In terms of disability age under 5, the demographic groups most similar to Czechoslovakians are Cheyenne (1.5%, a difference of 0.34%), Delaware (1.5%, a difference of 0.54%), European (1.5%, a difference of 0.59%), British (1.5%, a difference of 1.7%), and Croatian (1.5%, a difference of 1.8%).
| Demographics | Rating | Rank | Disability Age Under 5 |
| Iroquois | 0.0 /100 | #274 | Tragic 1.5% |
| Brazilians | 0.0 /100 | #275 | Tragic 1.5% |
| Greeks | 0.0 /100 | #276 | Tragic 1.5% |
| Canadians | 0.0 /100 | #277 | Tragic 1.5% |
| Kiowa | 0.0 /100 | #278 | Tragic 1.5% |
| Danes | 0.0 /100 | #279 | Tragic 1.5% |
| British | 0.0 /100 | #280 | Tragic 1.5% |
| Czechoslovakians | 0.0 /100 | #281 | Tragic 1.5% |
| Cheyenne | 0.0 /100 | #282 | Tragic 1.5% |
| Delaware | 0.0 /100 | #283 | Tragic 1.5% |
| Europeans | 0.0 /100 | #284 | Tragic 1.5% |
| Croatians | 0.0 /100 | #285 | Tragic 1.5% |
| Tlingit-Haida | 0.0 /100 | #286 | Tragic 1.5% |
| Scandinavians | 0.0 /100 | #287 | Tragic 1.5% |
| Estonians | 0.0 /100 | #288 | Tragic 1.5% |
Demographics Similar to Immigrants from South Eastern Asia by Disability Age Under 5
In terms of disability age under 5, the demographic groups most similar to Immigrants from South Eastern Asia are Immigrants from Iraq (1.1%, a difference of 0.010%), Mongolian (1.1%, a difference of 0.11%), Dominican (1.1%, a difference of 0.13%), Nicaraguan (1.1%, a difference of 0.15%), and Immigrants from Moldova (1.1%, a difference of 0.22%).
| Demographics | Rating | Rank | Disability Age Under 5 |
| Albanians | 97.2 /100 | #91 | Exceptional 1.1% |
| Immigrants | Cuba | 97.0 /100 | #92 | Exceptional 1.1% |
| Spanish Americans | 96.9 /100 | #93 | Exceptional 1.1% |
| Sri Lankans | 96.8 /100 | #94 | Exceptional 1.1% |
| Immigrants | Moldova | 96.8 /100 | #95 | Exceptional 1.1% |
| Mongolians | 96.6 /100 | #96 | Exceptional 1.1% |
| Immigrants | Iraq | 96.5 /100 | #97 | Exceptional 1.1% |
| Immigrants | South Eastern Asia | 96.5 /100 | #98 | Exceptional 1.1% |
| Dominicans | 96.3 /100 | #99 | Exceptional 1.1% |
| Nicaraguans | 96.3 /100 | #100 | Exceptional 1.1% |
| Immigrants | Uganda | 96.1 /100 | #101 | Exceptional 1.1% |
| Immigrants | Morocco | 96.0 /100 | #102 | Exceptional 1.2% |
| Immigrants | Nicaragua | 96.0 /100 | #103 | Exceptional 1.2% |
| Indonesians | 95.9 /100 | #104 | Exceptional 1.2% |
| Immigrants | South Africa | 95.6 /100 | #105 | Exceptional 1.2% |