Czechoslovakian vs Immigrants from Hungary Disability Age Under 5
COMPARE
Czechoslovakian
Immigrants from Hungary
Disability Age Under 5
Disability Age Under 5 Comparison
Czechoslovakians
Immigrants from Hungary
1.5%
DISABILITY AGE UNDER 5
0.0/ 100
METRIC RATING
281st/ 347
METRIC RANK
1.4%
DISABILITY AGE UNDER 5
1.0/ 100
METRIC RATING
251st/ 347
METRIC RANK
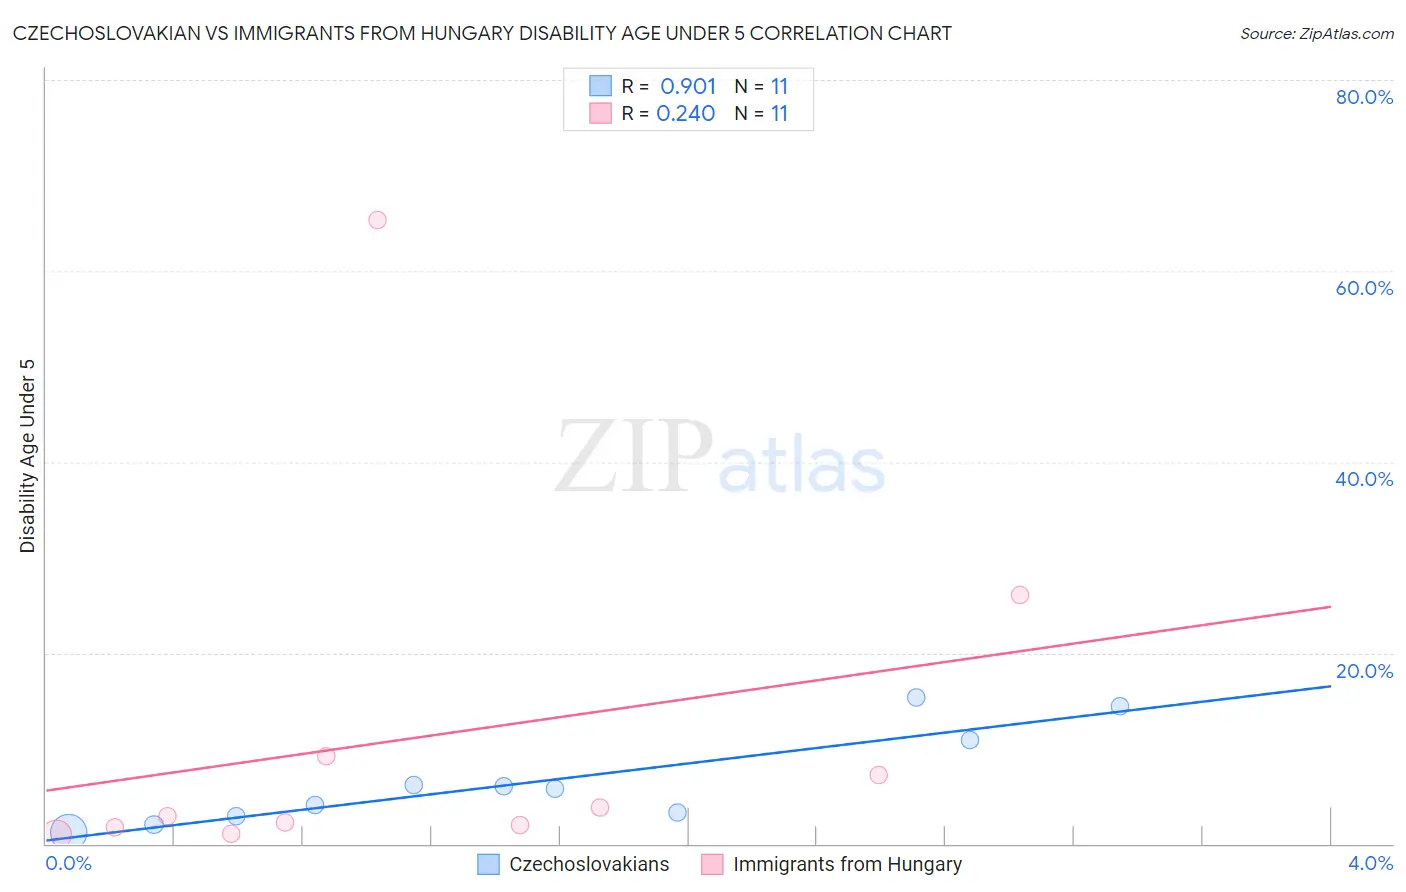
Czechoslovakian vs Immigrants from Hungary Disability Age Under 5 Correlation Chart
The statistical analysis conducted on geographies consisting of 199,678,332 people shows a near-perfect positive correlation between the proportion of Czechoslovakians and percentage of population with a disability under the age of 5 in the United States with a correlation coefficient (R) of 0.901 and weighted average of 1.5%. Similarly, the statistical analysis conducted on geographies consisting of 126,295,139 people shows a weak positive correlation between the proportion of Immigrants from Hungary and percentage of population with a disability under the age of 5 in the United States with a correlation coefficient (R) of 0.240 and weighted average of 1.4%, a difference of 10.3%.
Disability Age Under 5 Correlation Summary
| Measurement | Czechoslovakian | Immigrants from Hungary |
| Minimum | 1.2% | 0.96% |
| Maximum | 15.3% | 65.4% |
| Range | 14.1% | 64.4% |
| Mean | 6.5% | 11.1% |
| Median | 5.8% | 2.9% |
| Interquartile 25% (IQ1) | 2.8% | 1.8% |
| Interquartile 75% (IQ3) | 10.8% | 9.2% |
| Interquartile Range (IQR) | 8.0% | 7.4% |
| Standard Deviation (Sample) | 4.9% | 19.4% |
| Standard Deviation (Population) | 4.6% | 18.5% |
Similar Demographics by Disability Age Under 5
Demographics Similar to Czechoslovakians by Disability Age Under 5
In terms of disability age under 5, the demographic groups most similar to Czechoslovakians are Cheyenne (1.5%, a difference of 0.34%), Delaware (1.5%, a difference of 0.54%), European (1.5%, a difference of 0.59%), British (1.5%, a difference of 1.7%), and Croatian (1.5%, a difference of 1.8%).
| Demographics | Rating | Rank | Disability Age Under 5 |
| Iroquois | 0.0 /100 | #274 | Tragic 1.5% |
| Brazilians | 0.0 /100 | #275 | Tragic 1.5% |
| Greeks | 0.0 /100 | #276 | Tragic 1.5% |
| Canadians | 0.0 /100 | #277 | Tragic 1.5% |
| Kiowa | 0.0 /100 | #278 | Tragic 1.5% |
| Danes | 0.0 /100 | #279 | Tragic 1.5% |
| British | 0.0 /100 | #280 | Tragic 1.5% |
| Czechoslovakians | 0.0 /100 | #281 | Tragic 1.5% |
| Cheyenne | 0.0 /100 | #282 | Tragic 1.5% |
| Delaware | 0.0 /100 | #283 | Tragic 1.5% |
| Europeans | 0.0 /100 | #284 | Tragic 1.5% |
| Croatians | 0.0 /100 | #285 | Tragic 1.5% |
| Tlingit-Haida | 0.0 /100 | #286 | Tragic 1.5% |
| Scandinavians | 0.0 /100 | #287 | Tragic 1.5% |
| Estonians | 0.0 /100 | #288 | Tragic 1.5% |
Demographics Similar to Immigrants from Hungary by Disability Age Under 5
In terms of disability age under 5, the demographic groups most similar to Immigrants from Hungary are African (1.4%, a difference of 0.030%), Bermudan (1.4%, a difference of 0.040%), Immigrants from Scotland (1.4%, a difference of 0.040%), Eastern European (1.4%, a difference of 0.12%), and Immigrants from England (1.4%, a difference of 0.15%).
| Demographics | Rating | Rank | Disability Age Under 5 |
| Spaniards | 1.4 /100 | #244 | Tragic 1.4% |
| Potawatomi | 1.1 /100 | #245 | Tragic 1.4% |
| Russians | 1.0 /100 | #246 | Tragic 1.4% |
| Immigrants | England | 1.0 /100 | #247 | Tragic 1.4% |
| Eastern Europeans | 1.0 /100 | #248 | Tragic 1.4% |
| Bermudans | 1.0 /100 | #249 | Tragic 1.4% |
| Africans | 1.0 /100 | #250 | Tragic 1.4% |
| Immigrants | Hungary | 1.0 /100 | #251 | Tragic 1.4% |
| Immigrants | Scotland | 0.9 /100 | #252 | Tragic 1.4% |
| Australians | 0.7 /100 | #253 | Tragic 1.4% |
| Immigrants | Brazil | 0.7 /100 | #254 | Tragic 1.4% |
| Immigrants | Liberia | 0.6 /100 | #255 | Tragic 1.4% |
| Immigrants | Western Europe | 0.5 /100 | #256 | Tragic 1.4% |
| Slovenes | 0.3 /100 | #257 | Tragic 1.4% |
| Costa Ricans | 0.3 /100 | #258 | Tragic 1.4% |