Immigrants from Ethiopia vs Ottawa Disability Age Under 5
COMPARE
Immigrants from Ethiopia
Ottawa
Disability Age Under 5
Disability Age Under 5 Comparison
Immigrants from Ethiopia
Ottawa
1.1%
DISABILITY AGE UNDER 5
99.2/ 100
METRIC RATING
61st/ 347
METRIC RANK
1.7%
DISABILITY AGE UNDER 5
0.0/ 100
METRIC RATING
321st/ 347
METRIC RANK
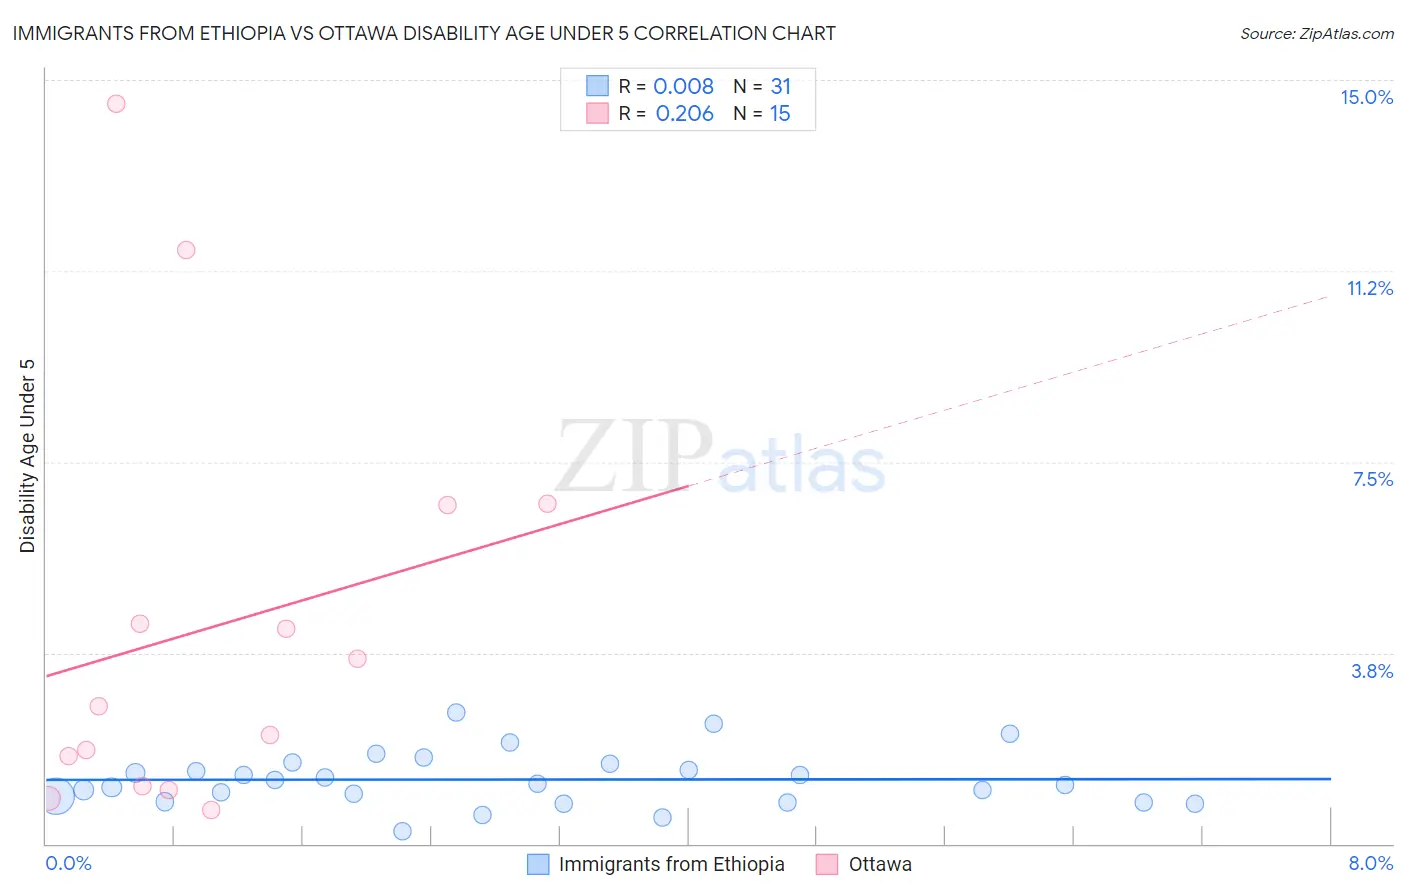
Immigrants from Ethiopia vs Ottawa Disability Age Under 5 Correlation Chart
The statistical analysis conducted on geographies consisting of 138,545,864 people shows no correlation between the proportion of Immigrants from Ethiopia and percentage of population with a disability under the age of 5 in the United States with a correlation coefficient (R) of 0.008 and weighted average of 1.1%. Similarly, the statistical analysis conducted on geographies consisting of 39,604,340 people shows a weak positive correlation between the proportion of Ottawa and percentage of population with a disability under the age of 5 in the United States with a correlation coefficient (R) of 0.206 and weighted average of 1.7%, a difference of 54.7%.
Disability Age Under 5 Correlation Summary
| Measurement | Immigrants from Ethiopia | Ottawa |
| Minimum | 0.25% | 0.66% |
| Maximum | 2.6% | 14.5% |
| Range | 2.3% | 13.9% |
| Mean | 1.3% | 4.3% |
| Median | 1.2% | 2.7% |
| Interquartile 25% (IQ1) | 0.83% | 1.1% |
| Interquartile 75% (IQ3) | 1.6% | 6.6% |
| Interquartile Range (IQR) | 0.74% | 5.5% |
| Standard Deviation (Sample) | 0.53% | 4.1% |
| Standard Deviation (Population) | 0.52% | 4.0% |
Similar Demographics by Disability Age Under 5
Demographics Similar to Immigrants from Ethiopia by Disability Age Under 5
In terms of disability age under 5, the demographic groups most similar to Immigrants from Ethiopia are Immigrants from Switzerland (1.1%, a difference of 0.010%), Immigrants from Western Asia (1.1%, a difference of 0.060%), Immigrants from Vietnam (1.1%, a difference of 0.12%), Egyptian (1.1%, a difference of 0.58%), and Immigrants from Malaysia (1.1%, a difference of 0.82%).
| Demographics | Rating | Rank | Disability Age Under 5 |
| Immigrants | El Salvador | 99.6 /100 | #54 | Exceptional 1.1% |
| Salvadorans | 99.5 /100 | #55 | Exceptional 1.1% |
| Ecuadorians | 99.5 /100 | #56 | Exceptional 1.1% |
| Assyrians/Chaldeans/Syriacs | 99.5 /100 | #57 | Exceptional 1.1% |
| Immigrants | Egypt | 99.4 /100 | #58 | Exceptional 1.1% |
| Immigrants | Malaysia | 99.4 /100 | #59 | Exceptional 1.1% |
| Immigrants | Western Asia | 99.2 /100 | #60 | Exceptional 1.1% |
| Immigrants | Ethiopia | 99.2 /100 | #61 | Exceptional 1.1% |
| Immigrants | Switzerland | 99.2 /100 | #62 | Exceptional 1.1% |
| Immigrants | Vietnam | 99.1 /100 | #63 | Exceptional 1.1% |
| Egyptians | 98.9 /100 | #64 | Exceptional 1.1% |
| Immigrants | Korea | 98.8 /100 | #65 | Exceptional 1.1% |
| Immigrants | Indonesia | 98.7 /100 | #66 | Exceptional 1.1% |
| Immigrants | Belize | 98.7 /100 | #67 | Exceptional 1.1% |
| South Africans | 98.7 /100 | #68 | Exceptional 1.1% |
Demographics Similar to Ottawa by Disability Age Under 5
In terms of disability age under 5, the demographic groups most similar to Ottawa are Scotch-Irish (1.7%, a difference of 0.060%), German (1.7%, a difference of 0.57%), Slovak (1.7%, a difference of 0.59%), Irish (1.7%, a difference of 0.89%), and French (1.7%, a difference of 1.2%).
| Demographics | Rating | Rank | Disability Age Under 5 |
| Norwegians | 0.0 /100 | #314 | Tragic 1.7% |
| Dutch | 0.0 /100 | #315 | Tragic 1.7% |
| Immigrants | Cabo Verde | 0.0 /100 | #316 | Tragic 1.7% |
| French | 0.0 /100 | #317 | Tragic 1.7% |
| Irish | 0.0 /100 | #318 | Tragic 1.7% |
| Slovaks | 0.0 /100 | #319 | Tragic 1.7% |
| Scotch-Irish | 0.0 /100 | #320 | Tragic 1.7% |
| Ottawa | 0.0 /100 | #321 | Tragic 1.7% |
| Germans | 0.0 /100 | #322 | Tragic 1.7% |
| Chickasaw | 0.0 /100 | #323 | Tragic 1.7% |
| Cherokee | 0.0 /100 | #324 | Tragic 1.8% |
| Immigrants | Portugal | 0.0 /100 | #325 | Tragic 1.8% |
| Sioux | 0.0 /100 | #326 | Tragic 1.8% |
| Osage | 0.0 /100 | #327 | Tragic 1.8% |
| Americans | 0.0 /100 | #328 | Tragic 1.9% |