Immigrants from the Azores vs Ottawa Disability Age Under 5
COMPARE
Immigrants from the Azores
Ottawa
Disability Age Under 5
Disability Age Under 5 Comparison
Immigrants from the Azores
Ottawa
2.2%
DISABILITY AGE UNDER 5
0.0/ 100
METRIC RATING
339th/ 347
METRIC RANK
1.7%
DISABILITY AGE UNDER 5
0.0/ 100
METRIC RATING
321st/ 347
METRIC RANK
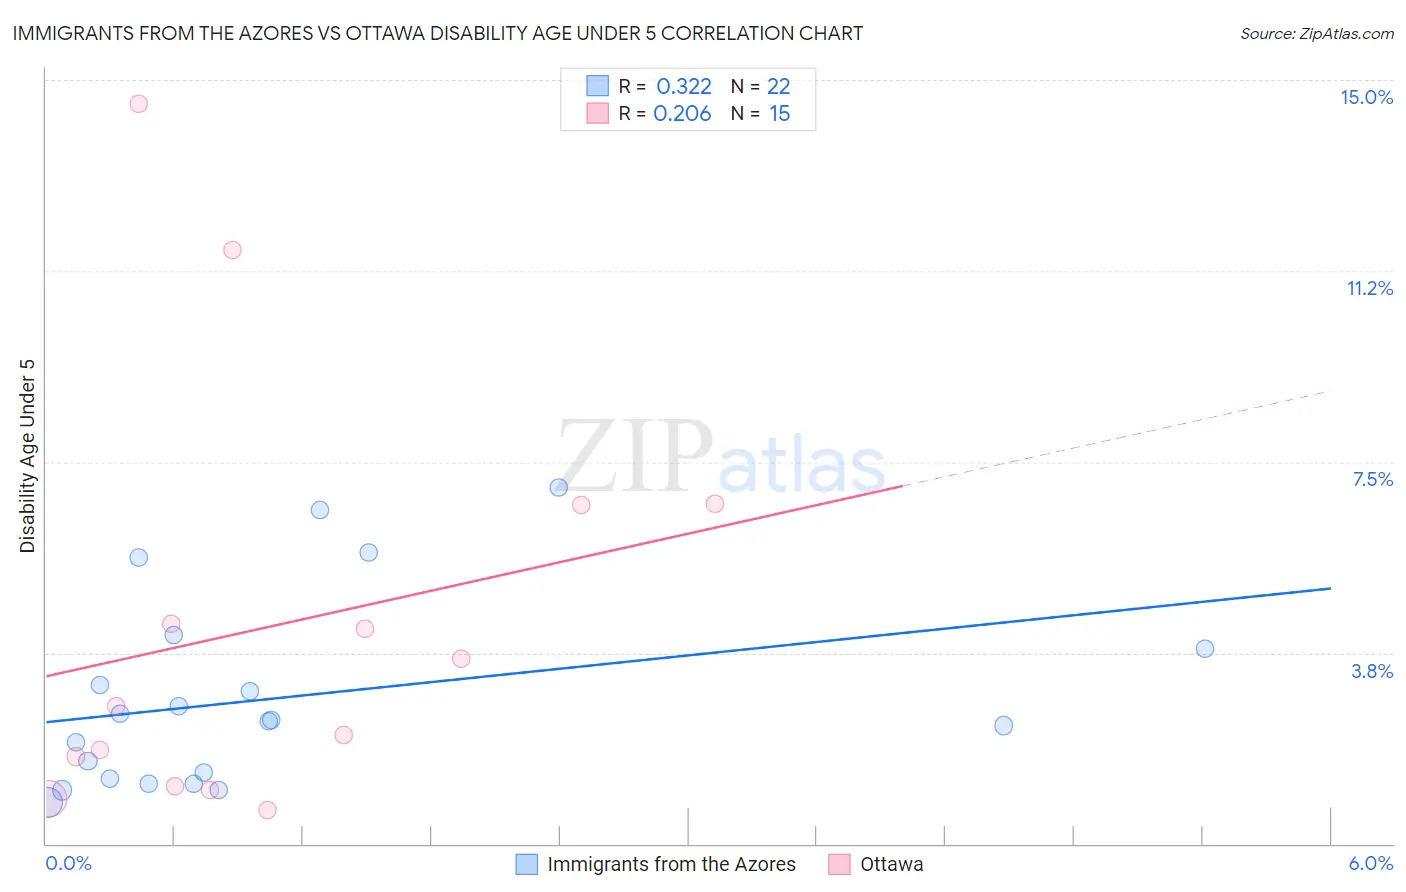
Immigrants from the Azores vs Ottawa Disability Age Under 5 Correlation Chart
The statistical analysis conducted on geographies consisting of 32,548,094 people shows a mild positive correlation between the proportion of Immigrants from the Azores and percentage of population with a disability under the age of 5 in the United States with a correlation coefficient (R) of 0.322 and weighted average of 2.2%. Similarly, the statistical analysis conducted on geographies consisting of 39,604,340 people shows a weak positive correlation between the proportion of Ottawa and percentage of population with a disability under the age of 5 in the United States with a correlation coefficient (R) of 0.206 and weighted average of 1.7%, a difference of 30.6%.
Disability Age Under 5 Correlation Summary
| Measurement | Immigrants from the Azores | Ottawa |
| Minimum | 0.81% | 0.66% |
| Maximum | 7.0% | 14.5% |
| Range | 6.2% | 13.9% |
| Mean | 2.9% | 4.3% |
| Median | 2.4% | 2.7% |
| Interquartile 25% (IQ1) | 1.3% | 1.1% |
| Interquartile 75% (IQ3) | 3.8% | 6.6% |
| Interquartile Range (IQR) | 2.6% | 5.5% |
| Standard Deviation (Sample) | 1.9% | 4.1% |
| Standard Deviation (Population) | 1.8% | 4.0% |
Demographics Similar to Immigrants from the Azores and Ottawa by Disability Age Under 5
In terms of disability age under 5, the demographic groups most similar to Immigrants from the Azores are Tohono O'odham (2.2%, a difference of 2.2%), Menominee (2.3%, a difference of 2.8%), Apache (2.0%, a difference of 10.0%), Paraguayan (2.0%, a difference of 13.2%), and Pennsylvania German (1.9%, a difference of 14.6%). Similarly, the demographic groups most similar to Ottawa are Scotch-Irish (1.7%, a difference of 0.060%), German (1.7%, a difference of 0.57%), Chickasaw (1.7%, a difference of 1.7%), Cherokee (1.8%, a difference of 3.5%), and Immigrants from Portugal (1.8%, a difference of 4.9%).
| Demographics | Rating | Rank | Disability Age Under 5 |
| Scotch-Irish | 0.0 /100 | #320 | Tragic 1.7% |
| Ottawa | 0.0 /100 | #321 | Tragic 1.7% |
| Germans | 0.0 /100 | #322 | Tragic 1.7% |
| Chickasaw | 0.0 /100 | #323 | Tragic 1.7% |
| Cherokee | 0.0 /100 | #324 | Tragic 1.8% |
| Immigrants | Portugal | 0.0 /100 | #325 | Tragic 1.8% |
| Sioux | 0.0 /100 | #326 | Tragic 1.8% |
| Osage | 0.0 /100 | #327 | Tragic 1.8% |
| Americans | 0.0 /100 | #328 | Tragic 1.9% |
| Houma | 0.0 /100 | #329 | Tragic 1.9% |
| Choctaw | 0.0 /100 | #330 | Tragic 1.9% |
| French Canadians | 0.0 /100 | #331 | Tragic 1.9% |
| Chippewa | 0.0 /100 | #332 | Tragic 1.9% |
| Dutch West Indians | 0.0 /100 | #333 | Tragic 1.9% |
| Natives/Alaskans | 0.0 /100 | #334 | Tragic 1.9% |
| Pennsylvania Germans | 0.0 /100 | #335 | Tragic 1.9% |
| Paraguayans | 0.0 /100 | #336 | Tragic 2.0% |
| Apache | 0.0 /100 | #337 | Tragic 2.0% |
| Tohono O'odham | 0.0 /100 | #338 | Tragic 2.2% |
| Immigrants | Azores | 0.0 /100 | #339 | Tragic 2.2% |
| Menominee | 0.0 /100 | #340 | Tragic 2.3% |